Nikon Instruments Inc. | Americas
- en Change Region
- Global Site
Nikon’s flagship NIS-Elements AR software integrates fully automated image acquisition, advanced device control, and powerful analysis and visualization tools. It supports 6D imaging and offers a comprehensive suite of capabilities, including volume rendering, movie creation, image processing, and archiving.
Developed for standard research applications such as analysis and photodocumentation of fluorescent imaging, NIS-Elements BR features up to four-dimensional acquisition and advanced device control capabilities.

NIS-Elements D is a documentation viewer allowing users to perform routine “point-and-shoot” image acquisition, manual measurements, and optional automated object counting.
Note: NIS-Elements D is not for clinical diagnostic use.
Dedicated interface for Nikon’s confocal and multiphoton systems, providing easy instrument setup and streamlined operation. Incorporates many of the features of NIS-Elements AR for advanced acquisition, image processing, analysis, visualization and data sharing capability.
Image resolution is defined as the smallest distance between 2 points that can be resolved. The theoretical limit of resolution for a conventional optical microscope is approximately 200 nm. Higher resolution images can be theoretically achieved with confocal microscopes, but this has not been effectively achieved. Resolution can be increased beyond the conventional confocal image resolution (up to ~1.5 times improvement in XY; up to ~1.7 times improvement in Z) by using specific image acquisition and processing techniques.
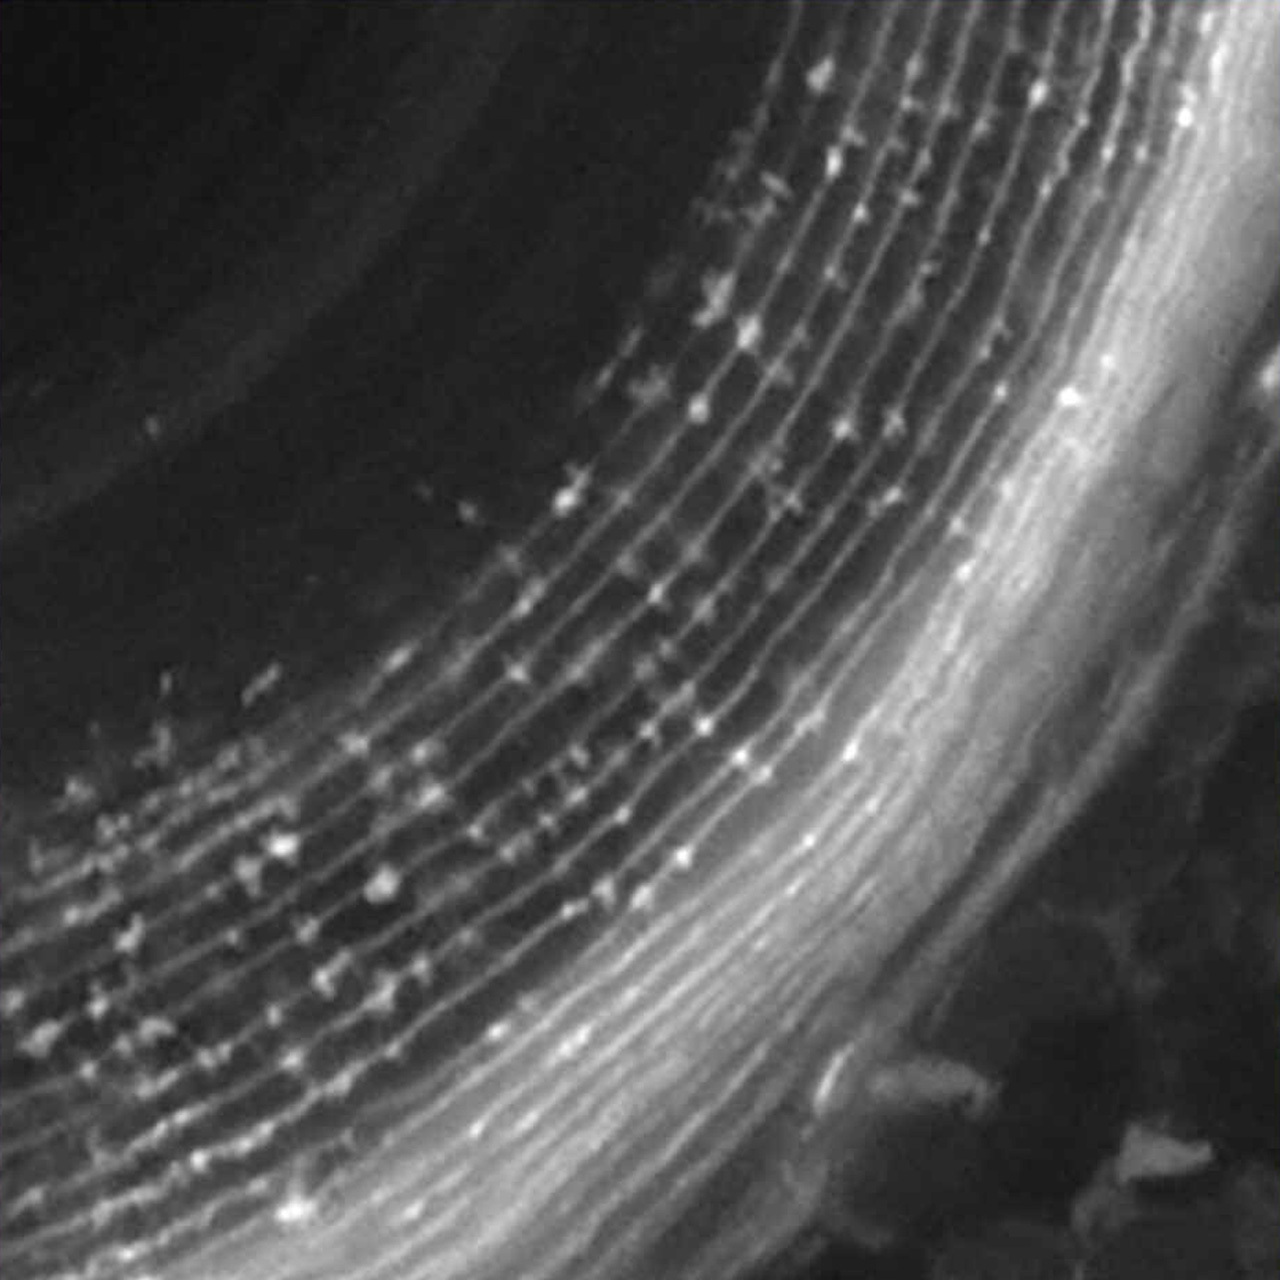
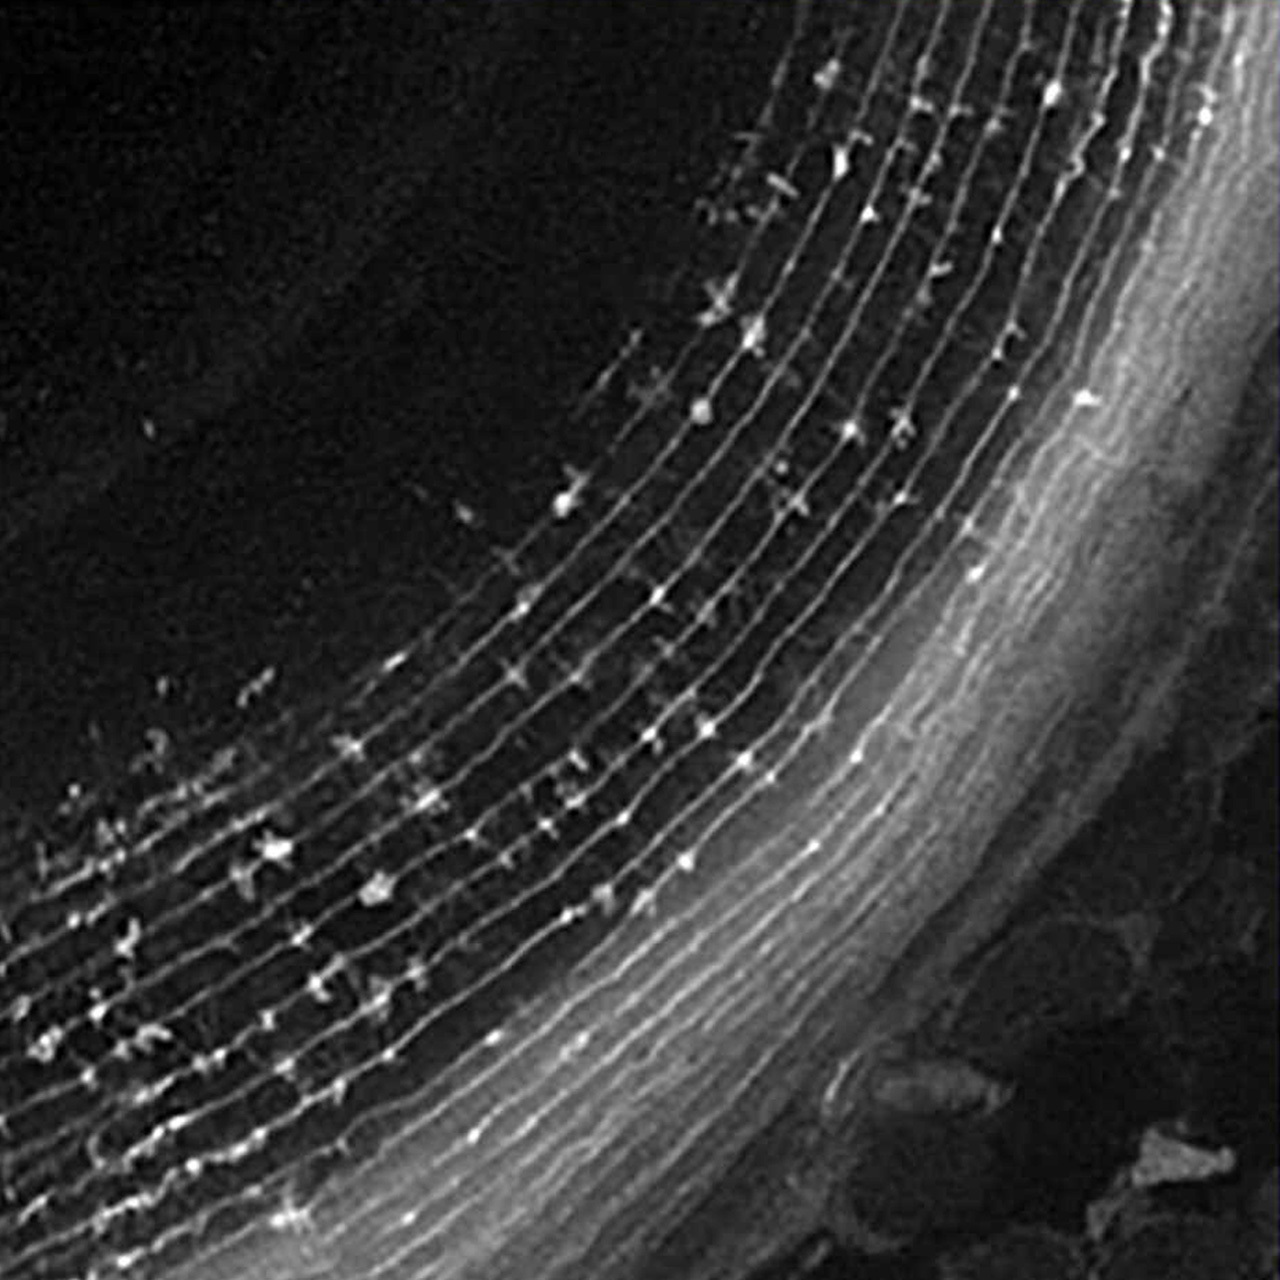
Zebrafish lens at 5 dpf. Nuclei (green) and actin filaments (red) are visualized with Cytox-green and Rhadamine-conjugated phalloidin, respectively. High magnification images indicate lens fiber cells, which become flat and stack against each other.
Image courtesy of: Drs. Toshiaki Mochizuki and Ichiro Masai, Developmental Neurobiology Unit, Okinawa Institute of Science and Technology Graduate University
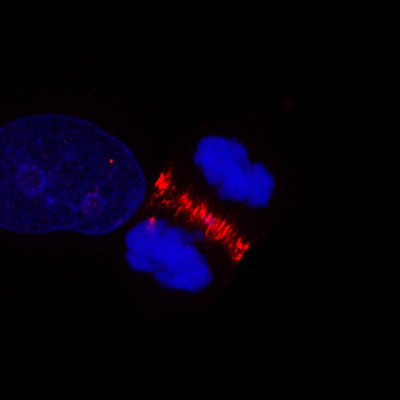
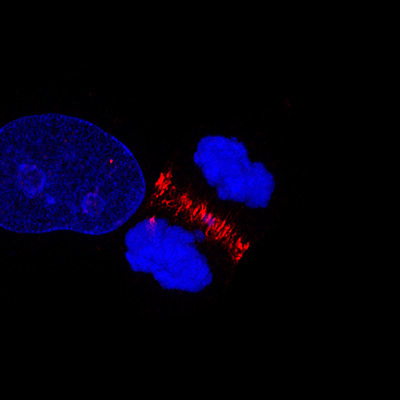
Red: Central spindle, Blue: Nuclei
Image courtesy of: Toshinori Hyodo Ph.D., Department of Biochemistry, Aichi Medical University School of Medicine
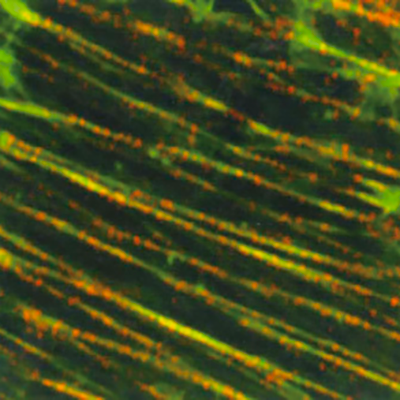
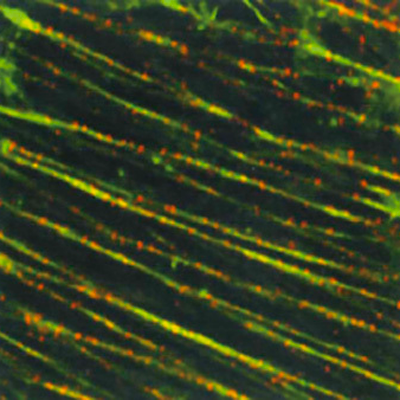
Stress Fibers (LLC-PK1, Pig Kidney Cells), Green: F-actin, Red: Myosin Heavy Chain
Image courtesy of: Keiju Kamijo Ph.D., Division of Anatomy and Cell Biology, Faculty of Medicine, Tohoku Medical and Pharmaceutical University
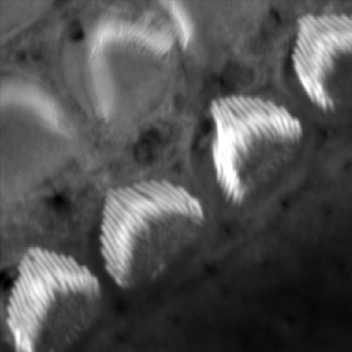
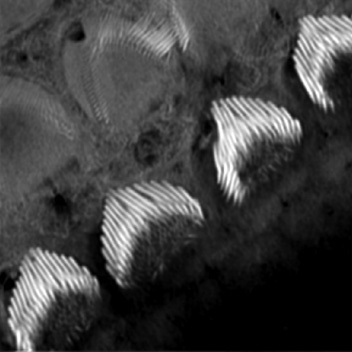
Apical surfaces of auditory epithelia of mouse cochleae were stained by Atto-565-phalloidin at postnatal day 2.
Image courtesy of: Dr. Hideru Togashi, Division of Molecular and Cellular Biology, Department of Biochemistry and Molecular Biology, Kobe University Graduate School of Medicine
NIS-Elements HC, designed for High Content applications, offers specialized tools for whole well-plate imaging, heat maps, graphing, and cell-based image analysis. It streamlines high-speed, automated acquisition, review, and analysis of multiple well-plate experiments, with wizards that simplify setup and parameter definition, including plate configuration, handling, autofocusing, filter switching, and detector control.
Streamlines high-speed, automated well-plate acquisition, data review, analysis and management of multiple well plate experiments.
NIS-Elements HC interface simplifies experiment setup using wizards. Easily define acquisition parameters including well-plate configuration, plate handling, autofocusing, filter switching and detectors.
① Define general job parameters
• Z-stack
• Sample labelling
• Autofocus
• Sending task completion by e-mail or SNS
② Define optical configurations for image capture
③ Well plate setting
• Define well plate to use
• Select well plate for image capture
• Define XY image capture pattern inside a well
• Sample labelling
④ Define analysis
Realtime viewing of data acquisition and analysis progress for instant inspection. Multiple analysis assays can be run simultaneously during the imaging phase or run post-acquisition on offline stations.
Heat maps of well plates, sample images, binary masks, assay results, sample labels and other metadata are centralized for quick filtering, gating and drill down to cellular detail.
Plate view
Heat map
Sample labeling
Create graphs instantly for data review. Classify, filter, tile, label data points from several different graph types. NIS-Elements offers histogram, scatterplot, bar chart, XY line, classification and gating functions. Easily navigate within the Plate View and export to Excel or bitmap.