Nikon Instruments Inc. | Americas
- en Change Region
- Global Site
November 2023
Single-cell analysis is important for understanding how individual cells function and how they respond as a population. However, depending on the sample, it may not be possible to isolate specific cells while they are alive due to incompatibility with the sheathe fluid or flow rate of a cell-sorting device. Additionally, during single-cell isolation via cell sorter or fine capillary, the position and environment of cells change before and after sorting, making it difficult to observe and evaluate cells over time. While there are isolation methods based on antibiotics, these cannot be used for some of cell types such as pollen.
To bypass these problems, Dr. Yoko Mizuta et al., of the Institute of Transformative Bio-Molecules, Nagoya University, use the General Analysis (GA) and JOBS of NIS-Elements imaging software to efficiently isolate target cells by automated, infrared laser-mediated disruption of pollen grains within pollen populations. JOBS combines the individual functions of NIS-Elements, such as microscope control, image acquisition, image processing, and external device control, allowing users to create their own imaging workflows, and GA enables the automation of image analysis. This application note introduces automatic pollen isolation using GA and JOBS, based on the research of Dr. Mizuta et al.
Keywords: pollen, single-cell analysis, automated isolation, JOBS, GA
Figure 1. Overview of efficient isolation of gene-introduced pollen
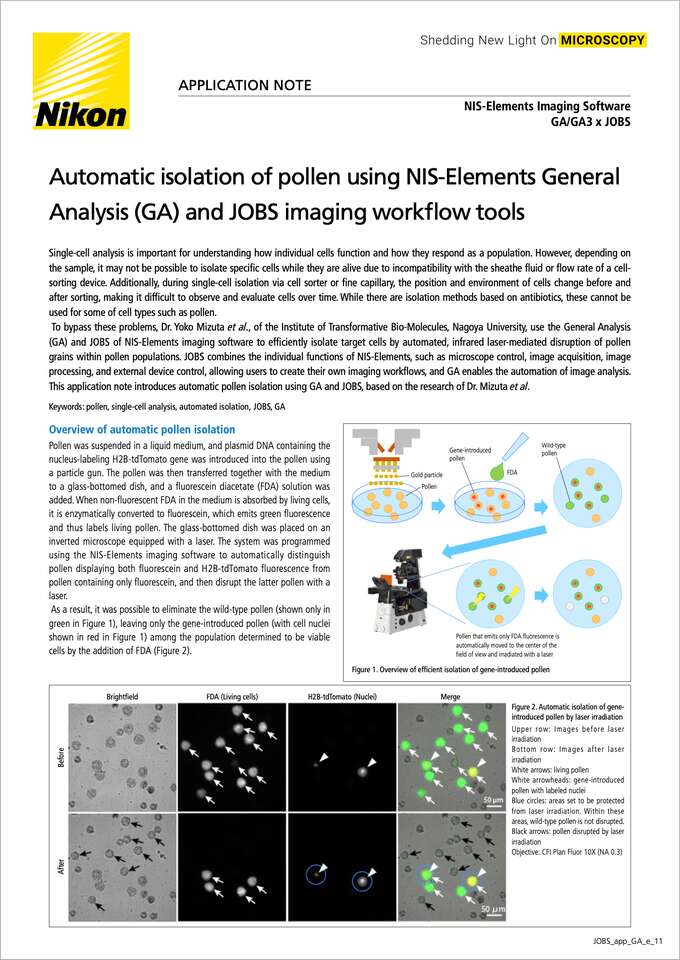
Pollen was suspended in a liquid medium, and plasmid DNA containing the nucleus-labeling H2B-tdTomato gene was introduced into the pollen using a particle gun. The pollen was then transferred together with the medium to a glass-bottomed dish, and a fluorescein diacetate (FDA) solution was added. When non-fluorescent FDA in the medium is absorbed by living cells, it is enzymatically converted to fluorescein, which emits green fluorescence and thus labels living pollen. The glass-bottomed dish was placed on an inverted microscope equipped with a laser. The system was programmed using the NIS-Elements imaging software to automatically distinguish pollen displaying both fluorescein and H2B-tdTomato fluorescence from pollen containing only fluorescein, and then disrupt the latter pollen with a laser.
As a result, it was possible to eliminate the wild-type pollen (shown only in green in Figure 1), leaving only the gene-introduced pollen (with cell nuclei shown in red in Figure 1) among the population determined to be viable cells by the addition of FDA (Figure 2).
Figure 2. Automatic isolation of gene-introduced pollen by laser irradiation
Upper row: Images before laser irradiation
Bottom row: Images after laser irradiation
White arrows: living pollen White arrowheads: gene-introduced pollen with labeled nuclei
Blue circles: areas set to be protected from laser irradiation. Within these areas, wild-type pollen is not disrupted.
Black arrows: pollen disrupted by laser irradiation
Objective: CFI Plan Fluor 10X (NA 0.3)
(1) Detect pollen from brightfield or autofluorescence images.
Here brightfield images were used as an example.
(2) Detect FDA-positive pollen (live cells) from FITC images and distinguish them from dust based on area (green mask).
(3) Detect pollen containing H2B-tdTomato-labeled cell nuclei (gene-introduced pollen) from Cy3 images (magenta mask), and draw a circular mask around the detected cell nuclei that is larger than the pollen size to protect gene-introduced pollen from irradiation (blue mask).
(4) Detect the green-masked region in (2), which does not overlap with the blue-masked region in (3) (pollen labeled with FITC only and not in close proximity to H2B-tdTomato-expressing pollen) as a laser irradiation target (yellow mask) .
(1) Set the imaging area (square inscribed in a 35mm dish) and the laser irradiation time.
(2) Acquire stitched Images (with two colors, CFP and FITC) using CFI Plan Fluor 10X (NA 0.3) objective.
(3) Binarize CFP and FITC images for each field of view.
(4) Extract the central position of each pollen and register the central position of pollen that emits only CFP fluorescence
* Pollen within φ33 μm centered on the bright spot in FITC image is excluded.
(5) Move the stage so that one of the pollen that emits only CFP fluorescence is in the center of the field of view.
(6) Irradiate the laser to disrupt the pollen.
(7) Repeat steps (5) and (6).
(8) After finishing work in one field of view, move to the next field of view and repeat steps (3) to (7).
By combining the GA/GA3 and JOBS modules of NIS-Elements imaging software, it is possible to automatically detect specific cells from a large population during imaging. To demonstrate this application, GA and JOBS were set to detect extraneous wild-type pollen, automatically move the stage so that such pollen is in the center of the field of view, and disrupt it by laser irradiation. As a result, efficient isolation of gene-introduced pollen is possible despite low gene-introduction efficiency and incompatibility with other techniques such as cell sorters.
We would like to express our deepest gratitude to Dr. Yoko Mizuta of the Institute of Transformative Bio-Molecules, Nagoya University, for providing images and research information in preparing this application note.
Target pollen isolation using automated infrared laser-mediated cell disruption
Ikuma Kaneshiro, Masako Igarashi, Tetsuya Higashiyama and Yoko Mizuta
Quantitative Plant Biology , Volume 3 , 2022 , e30
An optional software that enables automatic operation by customizing the imaging flow by combining functions such as microscope control, acquisition, processing, and analysis of images, numerical calculation, conditional branching, and control of external devices.
An optional software for customizing the automation of image analysis. GA3 can customize automation of analytical and statistical processing of complex workflows such as 3D volume imaging and 4D tracking.


