ヒト胚性幹細胞コロニー成長のビデオバイオインフォマティクス解析
Abstract
Because video data are complex and are comprised of many images, mining information from video material is difficult to do without the aid of computer software. Video bioinformatics is a powerful quantitative approach for extracting spatio-temporal data from video images using computer software to perform dating mining and analysis. In this article, we introduce a video bioinformatics method for quantifying the growth of human embryonic stem cells (hESC) by analyzing time-lapse videos collected in a Nikon BioStation CT incubator equipped with a camera for video imaging. In our experiments, hESC colonies that were attached to Matrigel were filmed for 48 hours in the BioStation CT. To determine the rate of growth of these colonies, recipes were developed using CL-Quant software which enables users to extract various types of data from video images. To accurately evaluate colony growth, three recipes were created. The first segmented the image into the colony and background, the second enhanced the image to define colonies throughout the video sequence accurately, and the third measured the number of pixels in the colony over time. The three recipes were run in sequence on video data collected in a BioStation CT to analyze the rate of growth of individual hESC colonies over 48 hours. To verify the truthfulness of the CL-Quant recipes, the same data were analyzed manually using Adobe Photoshop software. When the data obtained using the CL-Quant recipes and Photoshop were compared, results were virtually identical, indicating the CL-Quant recipes were truthful. The method described here could be applied to any video data to measure growth rates of hESC or other cells that grow in colonies. In addition, other video bioinformatics recipes can be developed in the future for other cell processes such as migration, apoptosis, and cell adhesion.
Protocol
Part 1: Experimental Procedure
Video data contain an abundance of information. However, this information is often difficult to extract and when done manually by humans and may require many hours of personnel time to complete. Manual analysis by humans is also subject to variation in interpretation and error. Video bioinformatics involves the use of computer software to mine specific data from video images. This method of analysis is rapid and can eliminate error that occurs when analysis is done manually by humans. The purpose of this article is to demonstrate a method for quantifying human embryonic stem cell colony growth using a video bioinformatics method.
In this paper, time lapse video images were collected using a Nikon BioStation CT incubation unit that allows multiple fields of cells to be imaged over time (Fig. 1). The methods described in this report are applicable to video data collected by any video microscopic set up.
In our experimental design, we plated H9 hESC in 12-well tissue culture plates for 48 hours. During this interval, colonies were allowed to fully attach and spread on Matrigel. Then, plates with attached hESC colonies were transferred to the BioStation CT and incubated for an additional 48 hours. While in the BioStation, images of the colonies were collected at 7 minute intervals and were later used to create time-lapse video sequences. Videos for each colony were then analyzed to quantify colony growth using video bioinformatics recipes developed with the CL-Quant software. The analyses done using recipes created with the CL-Quant software were checked for truthfulness manually using Adobe Photoshop.
Part 2: Preparation of attached hESC colonies
- Grow hESC on Matrigel coated 6-well plates, and once 70% confluency is reached, replate one well of the 6-well plate into 5 wells of a 12-well Matrigel coated plate as follows.
- Aspirate medium from a well containing hESC.
- Rinse well 2x with 1ml of PBS.
- Add 1ml of Accutase and incubate for 1 minute at 37°C and 5% CO2.
- Add 10-12 glass beads into the well and shake the plate gently until colonies completely detach from the bottom of the well.
- Neutralize Accutase using 1ml of mTeSR medium or mEF conditioned medium.
- Centrifuge the cell suspension in a 15ml conical tube at 200g for 3 minutes.
- Decant the supernatant and the break pellet with 500μl of fresh mTeSR medium.
- Plate drop wise 100μl of the hESC suspension into each well in a 12-well plate.
- Rock plate back and forth gently and observe cultures under a light microscope Make sure that cell clumps are evenly distributed throughout the plate.
- Place the 12-well plate back into the incubator.
- Allow hESC to attach and grow for 48 hours (a shorter time may be used).
- After 48 hours, decant the medium and wash wells with 500ul of PBS to remove unattached cells.
- Add 1ml of mTeSR medium to each well.
- Comment: Immediately place the plate into the incubator/microscope for video imaging.
- Begin collecting time-lapse images. Try to select fields with discrete single colonies that are not likely to grow into other colonies.
- Other methods for culturing and setting up hESC can be used in place of the above protocol.
Part 3: Video Bioinformatics
CL-Quant software was used to create three "recipes" that when run in sequence will determine the pixel number or area in microns for each colony over time. The three recipes are built in sequence and for this application include segmentation, enhancement, and measurement.
Analyzing hESC colony growth using the CL-Quant software/recipe development:
- The segmentation recipe is created first.
- Scan the entire video to make sure that the video is usable. Check to be sure the entire colony remains in the field of view and that other colonies do not enter the field.
- Open the segmentation wizard and click the "next" button.
- Select the correct image channel (i.e., phase, green, red, etc) and click the "next" button.
- Pick "soft matching" out of the 3 choices and click "next".
- Select "want" regions by circling regions on the image typically the outer edge of the colony to the central area of the colony.
- This area should be as small as possible but should be representative of the entire colony.
- When using phase contrast microscopy, be sure to include the halo around the colony for precise colony selection by the software.
- Pick 1 or 2 regions of interest that may show different pixel patterns within the colony, but do not pick too many "wants" which may result in inaccurate mask application.
- Click the "next" button.
- Select "don't want" regions by circling regions on the image that are not part of the colony and not part of the background. These are regions that have patterns you wish to suppress and include pixels of artifacts such as debris and dead cells. Click "next".
- Select "background" by circling regions you wish to suppress.
- The "don't want" and "background" regions differ in that background should be uniform and likely to show up in every frame.
- Typically we select the grey background around the colony.
- Click the "next" button.
- A colored mask should be displayed over your region of interest (Fig 2A).
- If the mask does not accurately cover the region of interest, the segmentation threshold range (located at the bottom right hand corner of the software display) may be increased or decreased.
- The segmentation wizard prompts for further mask area fine tuning if necessary.
- If you wish to change your mask, select "update soft matching regions". This allows you to change the "want", "don't want", or "background" areas.
- If the mask is satisfactory, select "apply threshold and save my mask", and click the "next" button.
- The mask will then be displayed in a different color.
- Select "finish".
- The recipe should be displayed on the right upper corner of the software, and it should be called "segmentation recipe".
- Rename the recipe if you wish by right clicking and "rename".
- For spot checking, right click and place the mouse over "apply recipe".
- A menu will show that allows you to select the number of frames you wish use when spot checking the recipe. Run the recipe for every 10 frames to spot check the accuracy of mask placement.
- If the mask picks up parts of small unwanted regions or debris, you can create an "enhancement recipe" to improve fitting of the mask to the region of interest.
- To create an enhancement recipe, right click the "enhancement recipe" folder, and then click "new". A new enhancement recipe should be displayed.
- From the original field of view (FOV), click the "toggles enhancement module" button located to the right of the image. Mouse over icons in the toolbar to identify the correct one.
- Select "labeling" dropdown menu.
- Select "labeling 4 connected".
- Select "labeling 4 connected2".
- A new task bar should be displayed.
- Grab initial mask (mask0) from the segmentation recipe and drag it to the "input" box.
- The bar should now display "input mask #".
- Drag the icon with the "input mask #" to the mask 0 icon.
- Find "min size" in task bar and adjust number until only region of interest is displayed. Make sure you click on "execute" through each fitting trial.
- Once you are satisfied with your minimum size adjustment, click on the "enhancement recipe" you've created previously. (Fig. 2B)
- At the bottom of the screen, select "save to recipe".
- The software now prompts to "overwrite selected recipe?", select "yes"
- Spot check the enhancement recipe using the same procedures as above for spot checking segmentation.
- If satisfied with the segmentation and enhancement recipes, select 'create measurement template' on the right hand toolbar.
- Rename the template to if you wish.
- In the measurement template window, move cursor over clipart cell figure. Hold the Ctrl key and select the cell.
- Uncheck 'default parameter' and check 'area parameter' under 'morphology'.
- Exit 'template' window.
- Select the icon created in the measurement recipe.
- Rename the recipe.
- Move to and select 'template' tab in the upper right corner.
- Drag and drop your previously created measurement template onto the measurement window.
- Click 'Yes' to continue.
- In the measurement recipe window, select 'Channel mappings', then 'Whole cell'.
- Select 'Mask mappings'.
- Then select 'Whole cell' option for enhanced mask.
- Select the 'Measurement recipe' under the Recipe tab in the main window.
- Select the 'Save' icon within the Measurement recipe window.
- Then close the window.
- Now, close and reopen the 'FOV'.
- Right click the 'Recipe' icon, select 'Lock recipe list' and run the recipes sequentially on your video data.
Part 4: Checking recipe accuracy using the Photoshop software
In order to validate the recipe created with (CL-Quant software), the same data can be analyzed manually with Adobe Photoshop. For this analysis, every 10th frame (every 70 min time point) was analyzed to measure colony size over 48 hours.
- Open a frame of a colony image in Adobe Photoshop.
- Click on the Magic Wand Tool in the toolbar.
- Click on the area around the colony so the entire field is covered except the colony region.
- Click 'Edit in Quick Mask Mode' in the toolbar and click on the colony so the colony is selected.
- Make sure the dotted line around the colony fits right around the periphery of the colony and not inside it. If the dotted line is not around the periphery, change the tolerance value in the upper toolbar accordingly.
- Go to the 'Window' pull down menu and click 'Histogram'.
- Write down the pixel value when cache=1. If cache is 2, click the '!' to change to cache 1, and then note the pixel value.
- Repeat the above process for every 10th frame. Fewer total frames can be used if desired.
- Data collected using Photoshop and CL-Quant software can then be plotted together. If the CL-Quant recipes are truthful, the curves for the Photoshop and CL-Quant analysis should be very similar (Figs. 3-5).
- If the recipes developed with CL-Quant are truthful, they can be reliably applied to other video data.
- The value in using video bioinformatics in this analysis is that once the segmentation, enhancement, and measurement recipes are developed and validated, they will perform the analysis much more rapidly and more accurately than a human using Photoshop.
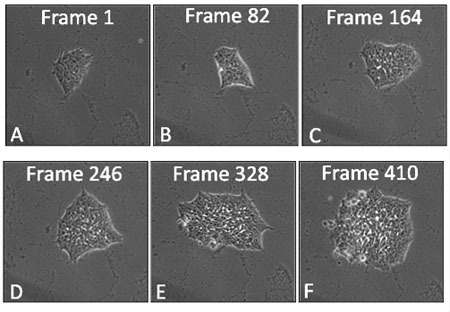
Figure 1: Film strip of a hESC colony showing frames at various times during 48 hours of growth in a BioStation CT. Frames were taken at 7 minute intervals.
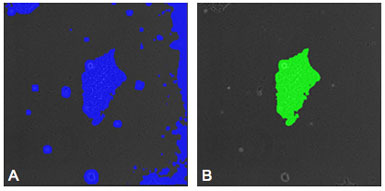
Figure 2: (A) Image of a hESC with a mask placed on the colony by the segmentation recipe. Areas of debris and background are also masked indicating that an enhancement recipe is needed to improve the accuracy of the evaluation. (B) Image of the same colony as shown in "A" after enhancement has been performed. The mask now selects only the colony and noise has been eliminated from the selection.
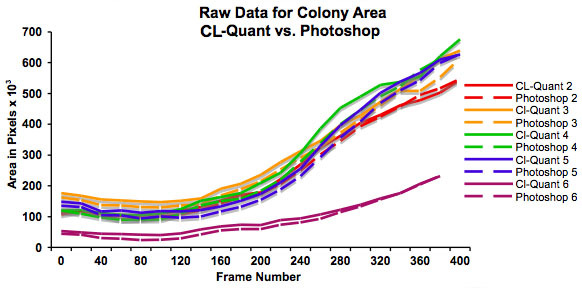
Figure 3: Graph showing increase in colony size (in pixels) over 48 hours as determined using CL-Quant software and Photoshop. This graph plots the raw data and shows that colonies start at different sizes. It also shows that both methods of measurement are in good agreement.
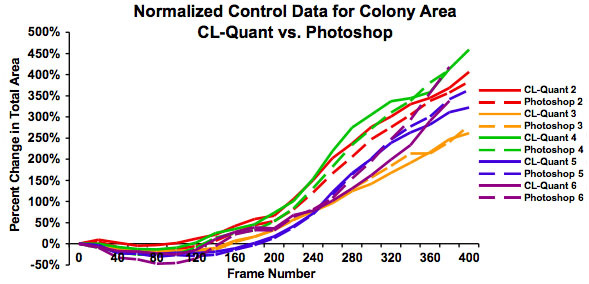
Figure 4: Graph showing the same data as in Figure 3 after normalization to show the percent increase in colony size over 48 hours. This shows that growth rates are similar regardless of starting colony size and that both measures of analysis give similar results.
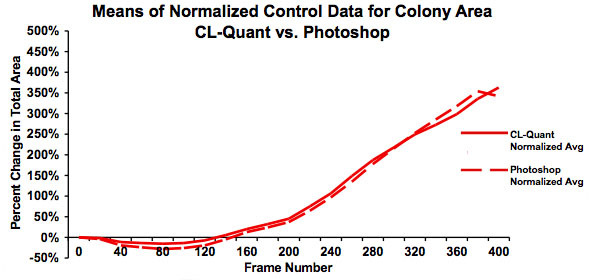
Figure 5: Graph showing the means for the normalized data in Figure 4. This graph clearly shows good agreement between the analyses done using video bioinformatics (CL-Quant software) and Photoshop and establishes that the recipe is truthful. The slight downturn in area for the Photoshop data at frame 325 is due to several videos not being included in the Photoshop analysis.
Discussion
Video bioinformatics tools are powerful for rapidly extracting data from video images. Our protocol for quantifying hESC colony growth demonstrates one application of video bioinformatics to a biological problem. This method is quantitative and has the interesting feature of revealing data from individual hESC colonies. Video bioinformatics recipes can be developed to monitor other cellular processes such as proliferation, migration, apoptosis, and cell attachment to the substrate, and cell attachment to adjacent cells. The accuracy of the recipes developed using CL-Quant software was validated using Photoshop and was found to be truthful. Once the appropriate recipes are developed, video data from any source can be analyzed very quickly. The time required to analyze video data using video bioinformatics tools is significantly less than the time needed for analysis performed by hand using Photoshop. Moreover, the analysis done by the computer is less prone to error, as the computer will analyze the data the same way each time, while a human performing an analysis may make errors or slightly different judgments each time an image is analyzed. Although not discussed as part of this protocol, videos can also be examined for morphological changes in the colony. This parameter would be useful in cases where treatment groups are included.
Acknowledgements
The development of this method was made possible by funding from the California Tobacco-Related Disease Research Program, the California Institute for Regenerative Medicine, and NSF IGERT grant on Video Bioinformatics (#0903667) at UCR. Sabrina Lin is supported by a Dissertation Fellowship from the Graduate Division, Shawn Forteno is supported by an NIH MARC Fellowship, and Shruthi Satish is supported by a Graduate Division Fellowship. We are grateful to Anna Trtchounian for her help preparing the figures. We also thank Sam Alworth and Ned Jastromb for teaching us how to use the CL-Quant software.
Materials
| Name | Company | Catalog Number | Comments |
| mTeSR1 Human Embryonic Stem Cell Maintenance Medium | Stem Cell Technologies | 05850 | or any suitable medium for hESC culture. |
| BD Matrigel | BD Biosciences | 356234 | or other suitable substrate. |
| DMEM/F12 Basal Medium | Invitrogen | 11330-032 | |
| Phosphate Buffered Saline without Ca2+ and Mg2+ | |||
| Accutase Enzyme Cell Detachment Medium | eBioscience | 00-4555-56 | or other suitable detachment enzyme. |
| 3mm Glass beads | Fisher Scientific | 11-312A | optional. |
| 12-well Tissue Culture Plates | BD Biosciences | 353043 | or any other plate format. |
| Nikon BioStation CT/IM | or other incubator/microscope suitable for collecting video data. | ||
| CL-Quant software (Nikon) and/or Photoshop (Adobe). |