アメフラシの細胞内カルシウム濃度およびシナプス効力の変化をモニタリング
Abstract
It has been suggested that changes in intracellular calcium mediate the induction of a number of important forms of synaptic plasticity (e.g., homosynaptic facilitation) 1. These hypotheses can be tested by simultaneously monitoring changes in intracellular calcium and alterations in synaptic efficacy. We demonstrate how this can be accomplished by combining calcium imaging with intracellular recording techniques. Our experiments are conducted in a buccal ganglion of the mollusc Aplysia californica. This preparation has a number of experimentally advantageous features: Ganglia can be easily removed from Aplysia and experiments use adult neurons that make normal synaptic connections and have a normal ion channel distribution. Due to the low metabolic rate of the animal and the relatively low temperatures (14-16 °C) that are natural for Aplysia, preparations are stable for long periods of time.
To detect changes in intracellular free calcium we will use the cell impermeant version of Calcium Orange 2 which is easily 'loaded' into a neuron via iontophoresis. When this long wavelength fluorescent dye binds to calcium, fluorescence intensity increases. Calcium Orange has fast kinetic properties 3 and, unlike ratiometric dyes (e.g., Fura 2), requires no filter wheel for imaging. It is fairly photo stable and less phototoxic than other dyes (e.g., fluo-3) 2,4. Like all non-ratiometric dyes, Calcium Orange indicates relative changes in calcium concentration But, because it is not possible to account for changes in dye concentration due to loading and diffusion, it can not be calibrated to provide absolute calcium concentrations
An upright, fixed stage, compound microscope was used to image neurons with a CCD camera capable of recording around 30 frames per second. In Aplysia this temporal resolution is more than adequate to detect even a single spike induced alteration in the intracellular calcium concentration. Sharp electrodes are simultaneously used to induce and record synaptic transmission in identified pre- and postsynaptic neurons. At the conclusion of each trial, a custom script combines electrophysiology and imaging data. To ensure proper synchronization we use a light pulse from a LED mounted in the camera port of the microscope. Manipulation of presynaptic calcium levels (e.g. via intracellular EGTA injection) allows us to test specific hypotheses, concerning the role of intracellular calcium in mediating various forms of plasticity.
Protocol
1. Preparation
- Anesthetize the animal by injecting 75-100 ml isotonic magnesium chloride solution The Aplysia we use for imaging are generally 150-200 grams and are obtained from Marinus Scientific.
- Pin the anesthetized animal to a wax covered dish. Syringe needles work well for this purpose; sterile techniques are not necessary. Using gross forceps and standard scissors make an incision in the animal's foot and expose the buccal mass. Locate the buccal ganglion. Using spring scissors and fine forceps, carefully free the ganglion by cutting all buccal nerves.
- Remove the ganglion and place it in a Sylgard coated dish containing artificial seawater. Place a few insect pins through the buccal nerves to stabilize the ganglion. Desheath the buccal ganglion using ultrafine forceps and spring scissors, so as to expose the neurons for intracellular recording. Then re-pin the ganglion using about 15 fine insect (minutien) pins. The ganglion must be held firmly in place as any movement will be problematic during imaging.
2. Prepare Electrodes
- Pull electrodes using glass capillary tubing with filament (e.g. WPI TW100F-4) and a puller. Settings should be individually determined to create electrodes of the required resistance. When filled with 3 M KAc (potassium acetate) our electrode resistance is generally about 10 MOhms if the electrodes are to be beveled, or about 5 MOhms if the beveling step is omitted.
- Fill one set of electrodes with a solution containing 3 M KAc/30 mM KCl using a syringe and microfil needle. These electrodes will be used for electrophysiology.
- Fill a second set of electrodes with the calcium indicator dye by dipping the back end of the electrode in dye, previously reconstituted with approx. 40 μl distilled water for 500μg dye. When the tip of the electrode has filled, back fill about 1/4 inch of the end of the electrode with 200 mM KCl to ensure good electrical contact.
- It is beneficial to bevel the electrodes, as this facilitates dye injection and reduces the damage done by multiple membrane penetrations. We use a custom beveler that generates a stream of a salt water / alumina powder suspension. The electrode is mounted in a holder and its tip enters the stream at a 45° angle. Electrode resistance is continuously monitored and the beveling terminated when the resistance reaches about 5 MOhm for KAc filled electrodes. The dye filled electrodes are beveled for an equal amount of time and typically have resistances of 15-20 MOhm.
3. Loading the Calcium Indicator Dye
- Place the preparation on an electrophysiology rig and visually locate the presynaptic neuron of interest. Many of our experiments are done with an identified sensory neuron utilized during feeding, B21 5, 6. The relatively fixed position, size (~100 μm), and elongated shape of B21's soma make it easy to locate.
- Impale the neuron of interest with an electrode containing the calcium indicator dye. B21's identity can be verified by impaling the post-synaptic neuron B8. Depolarization of B21 with ~8 nA current will trigger spikes and result in facilitating PSPs in B8 7.
- Inject dye in the presynaptic neuron of interest by passing hyperpolarizing pulses (typically -15 nA, 1 Hz, 75% duty cycle) for approximately 30 minutes. If dye loading is successful, the neuron's soma will acquire a faint pink color. Remove the dye-containing electrode by slowly withdrawing it from the neuron.
- Leave preparations for approximately 30 minutes to allow the dye to diffuse into the fine processes that make synaptic contact with follower neurons.
4. Calcium Imaging and Electrophysiological Recording
- Place the preparation on the imaging microscope. The dish with the preparation is held on a cooling platform with pieces of Permagum sealing cord which, unlike clay, remains sticky when wet. The fixed stage microscope focuses by moving the objective. The stage remains stationary, which allows attaching magnet mounted manipulators. As the high magnification makes vibrations (especially lateral movement) a problem, the entire imaging setup should be placed on a vibration isolation platform.
- Impale presynaptic and postsynaptic neurons with electrodes containing normal electrolyte solution.
- Select a filter block suitable to image Calcium Orange (excitation 549 nm, emission 576 nm) 8 and adjust the camera. Most scientific CCD cameras allow the investigator to choose a subset of CCD cells that are read out. Additionally, cells can be combined (binned). Selecting a smaller subset increases speed, while binning increases sensitivity. These two settings, together with the exposure time, determine the frame rate i.e. how many images can be acquired per second. Suitable settings will image an area of 580 x 350 μm2 with 500 x 300 pixels (using a 10x lens and a 0.5x camera adapter). Add neutral density filters to the light path to adjust the illumination intensity to the minimal amount that provides correct exposure with an exposure time <25 ms. These settings should result in a frame rate of about 30 Hz - which in Aplysia is fast enough to image single spike evoked calcium alterations. Finally, close the field aperture so that only the imaged area is illuminated.
- In the imaging software mark the neuron's regions you want to measure. In the Elements AR software this is done in the "Time Measurement" section by placing regions of interest (ROIs). B21 is a bipolar neuron and previous work has demonstrated that its lateral process contacts the postsynaptic neuron of interest 9. We generally image primary, secondary, and tertiary branches of the lateral process by placing a ROI over each part of the neuron. An additional ROI next to the dye filled neuron is measured to provide a background value that is later subtracted from all other data points.
- Instruct the electrophysiology acquisition (in these experiments Spike II) to wait for a trigger signal provided by the "frame readout" signal of the camera. Start the image acquisition (Elements AR); Spike II will now automatically start recording when the camera takes its first frame. You can also use a TTL output of the Power 1401 to briefly turn on a LED mounted in the microscope's camera port. This will provide a signal to subsequently synchronize imaging and electrophysiological data.
- Stimulate the presynaptic neuron by injecting a series of brief depolarizing current pulses at the desired frequency. It is important to monitor each pulse (e.g. with a stimulus triggered oscilloscope) to determine whether an action potential is successfully generated. While Calcium Orange is very photo-stable compared to other dyes, it is a good idea to record a control trial without stimulation to check how much dye bleaching occurs.
- In experiments in which intracellular calcium concentrations are manipulated, a drug such as EGTA is introduced into the presynaptic neuron and the stimulation and data acquisition steps described above are repeated.
5. Analysis of Representative Data
- Export the imaging data (the list of measured intensity values for each ROI) by writing it into a text file. A custom script in Spike II can then import the text file. This script also normalizes the values with the individual probe's area, and subtracts the value of the background probe. The data points are then plotted alongside the electrophysiology data as a "virtual RealWave" channel. The "channel process / time shift function" in Spike II is used to precisely align the imaging data points, using the LED signal as reference.
- To obtain values as percent change, analyze the imaging data by calculating the relative change in fluorescence as dF/Fo= (F-Fo)/ Fo. Fo denotes the fluorescence level just before the stimulus and F the fluorescence during the stimulus.
Representative Results
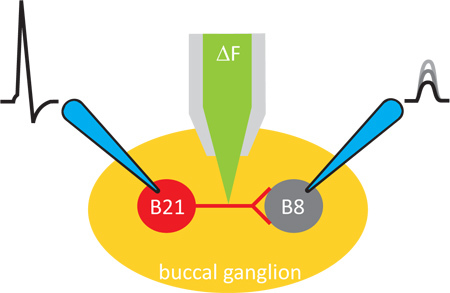
Figure 1. Overall scheme of the experiment. Experiments are conducted in a ganglion preparation of Aplysia. Changes in intracellular calcium are imaged with a fluorescent dye, which is iontophoretically introduced into the presynaptic neuron. Pre- and postsynaptic neurons are then impaled with sharp electrodes so that synaptic transmission can be induced and monitored.
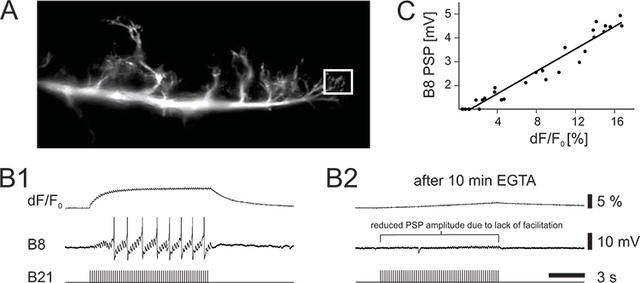
Figure 2. Calcium imaging and intracellular recording from identified neurons in the buccal ganglion of Aplysia. (A) Photo of the imaged lateral branch of neuron B21. The box indicates the measured region of interest. (B1) Intracellular stimulation of B21 evokes action potentials (bottom trace) and facilitating postsynaptic potentials (PSPs) in the postsynaptic follower neuron B8 (middle trace) causing it to also fire action potentials. Increases in presynaptic calcium fluorescence are shown in the top trace. (B2) Effect of presynaptic EGTA on homosynaptic facilitation. EGTA was intracellularly injected into B21 ~ 15 minutes before intracellular stimulation. It is thought that EGTA is a slow acting calcium chelator, which at low concentrations is not fast enough to suppress synaptic transmission. Note the reduction in the widespread calcium signal and the corresponding decrease in PSP amplitude. (C) The PSP amplitude correlates with the presynaptic calcium signal.
Discussion
We demonstrate techniques that can be used to simultaneously monitor the intracellular calcium concentration and evaluate the efficacy of synaptic transmission. These techniques are useful for determining how various forms of short-term plasticity are mediated.
The imaging is carried out with a fluorescence microscope and CCD camera. These equipment requirements are relatively modest when compared to most functional imaging set-ups. The technique is simple and easy to learn. While imaging with a CCD camera allows visualization of a large area with good temporal resolution, spatial resolution is limited. It is therefore a useful technique for testing hypotheses concerning the role of relatively widespread or 'background' increases in intracellular calcium. To improve spatial resolution and study calcium dynamics in spines, a laser-scanning confocal microscope, or a two photon microscope and the calcium indicator Calcium Green I could be used with only slight modifications of the protocol 10.
Disclosures
We have nothing to disclose.
Acknowledgements
A PHS Grant (MH51393) supported this work. Some of the Aplysia we use are provided by the National Resource for Aplysia of the University of Miami under Grant RR10294 from the National Center for Research Resources, NIH.
Materials
| Name | Company | Catalog Number | Comments |
| Calcium Orange | Invitrogen | C-3013 | |
| EGTA | Sigma | E-4378 | |
| Calcium calibration buffer kit | Invitrogen | C-3008MP | Useful for testing the sensitivity and dynamic range of the signal |
| Table 1. Reagents used. | |||
| FN-1 upright fluorescence microscope | Nikon Instruments | with Narishige ITS-FN1 stage | |
| NMN-21 manipulators | Narishige | mounted on stage with magnets | |
| CoolSNAP HQ2 CCD camera | Photometrics | ||
| NIS elements AR | Nikon Instruments | we used version 3.22 | |
| 10X/0.3w Plan Fluor objective | Nikon Instruments | this water immersion lens has a very long working distance of 3.5 mm | |
| X-Cite 120 PC metal halide lamp | EXFO | used for fluorescence imaging | |
| LS-DWL halogen lamp | Sumica | ||
| ET-CY3 filter set | Chroma Technology | ||
| Power 1401 A/D converter | Cambridge Electronic Design | sampling was done at 3 kHz | |
| Spike II Software | Cambridge Electronic Design | we used version 7.07 | |
| SEC-10 LX amplifier | NPI electronics | used with a 10X headstage | |
| Model 410 amplifier | Brownlee precision | used to amplify and filter the signal | |
| WS-4 | minus k Technology | vibration isolation for imaging | |
| cooling platform | custom made | brass plate through which ice water is pumped at a variable rate | |
References
- Zucker, R. S., Regehr, W. G. Short-term synaptic plasticity. Annu. Rev. Physiol. 64, 355-405 (2002).
- Eberhard, M., Erne, P. Calcium binding to fluorescent calcium indicators: Calcium green, calcium orange and calcium crimson. Biochem. Biophysical Res. Comm. 180, 209-215 (1991).
- Escobar, A. L., Velez, P., Kim, A. M., Cifuentes, F., Fill, M., Vergata, J. L. Kinetic properties of DM-nitrophen and calcium indicators: rapid transient response to flash photolysis. Eur. J. Physiol. 434, 615-631 (1997).
- Ivanov, A. I., Calabrese, R. L. Modulation of spike-mediated synaptic transmission by presynaptic background Ca2+ in leech heart interneurons. J. Neurosci. 23, 1206-1218 (2003).
- Rosen, S. C., Miller, M. W., Evans, C. G., Cropper, E. C., Kupfermann, I. Diverse synaptic connections between peptidergic radula mechanoafferent neurons and neurons in the feeding system of Aplysia. J. Neurophysiol. 83, 1605-1620 (2000).
- Ludwar, B. C. h, Evans, C. G., Jing, J., Cropper, E. C. Two distinct mechanisms mediate potentiating effects of depolarization on synaptic transmission. J. Neurophysiol. 102, 1976-1983 (2009).
- Evans, C. G., Ludwar, B. C. h, Askansas, J., Cropper, E. C. Effect of holding potential on the dynamics of homosynaptic facilitation. J. Neurosci. 31, 11039-11043 (2011).
- Haugland, R. P. The Handbook. 10th edition, Invitrogen. (2005).
- Borovikov, D., Evans, C. G., Jing, J., Rosen, S. C., Cropper, E. C. A proprioceptive role for an exteroceptive mechanoafferent neuron in Aplysia. J. Neurosci. 20, 1990-2002 (2000).
- Goldberg, J. H., Yuste, R. Chapter 38: A practical guide: Two-photon calcium imaging of spines and dendrites. Imaging in Neuroscience and Development. Cold Spring Harbor Laboratory Press. Cold Spring Harbor, NY. (2005).