Nikon Instruments Inc. | Americas
- en Change Region
- Global Site
September 2023
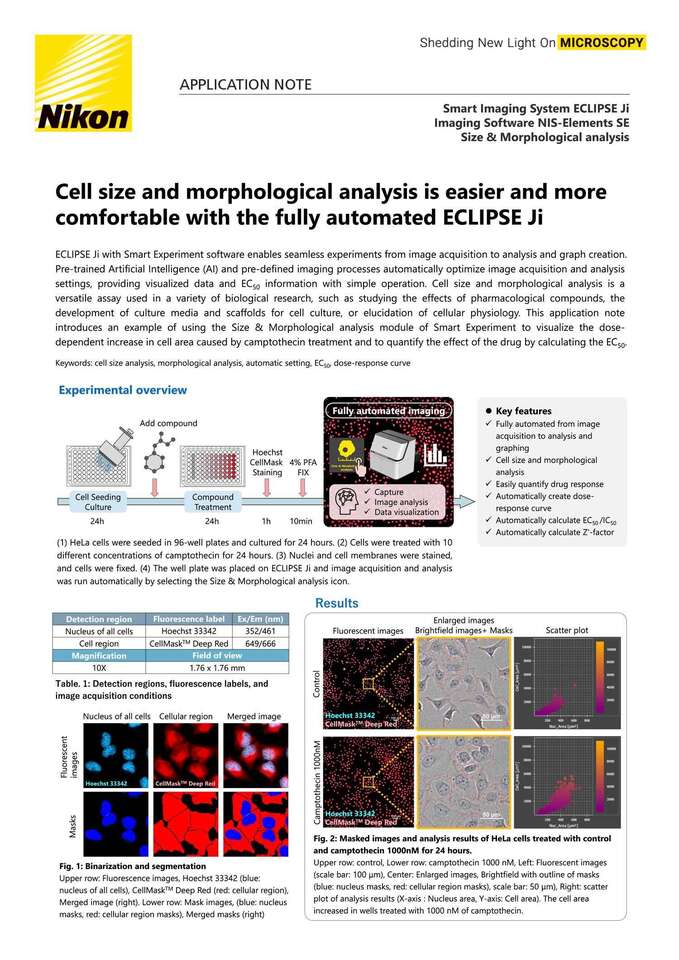
ECLIPSE Ji with Smart Experiment software enables seamless experiments from image acquisition to analysis and graph creation. Pre-trained Artificial Intelligence (AI) and pre-defined imaging processes automatically optimize image acquisition and analysis settings, providing visualized data and EC50 information with simple operation. Cell size and morphological analysis is a versatile assay used in a variety of biological research, such as studying the effects of pharmacological compounds, the development of culture media and scaffolds for cell culture, or elucidation of cellular physiology. This application note introduces an example of using the Size & Morphological analysis module of Smart Experiment to visualize the dose-dependent increase in cell area caused by camptothecin treatment and to quantify the effect of the drug by calculating the EC50.
Keywords: cell size analysis, morphological analysis, automatic setting, EC50, dose-response curve
(1) HeLa cells were seeded in 96-well plates and cultured for 24 hours. (2) Cells were treated with 10 different concentrations of camptothecin for 24 hours. (3) Nuclei and cell membranes were stained, and cells were fixed. (4) The well plate was placed on ECLIPSE Ji and image acquisition and analysis was run automatically by selecting the Size & Morphological analysis icon.
| Detection region | Fluorescence label | Ex/Em (nm) |
|---|---|---|
| Nucleus of all cells | Hoechst 33342 | 352/461 |
| Cell region | CellMaskTM Deep Red | 649/666 |
| Magnification | Field of view | |
| 10X | 1.76 x 1.76 mm |
|
Fig. 1: Binarization and segmentation
Upper row: Fluorescence images, Hoechst 33342 (blue: nucleus of all cells), CellMask™ Deep Red(red: cellular region), Merged image (right). Lower row: Mask images, (blue: nucleus masks, red: cellular region masks), Merged masks (right)
Fig. 2: Masked images and analysis results of HeLa cells treated with control and camptothecin1000nM for 24 hours.
Upper row: control, Lower row: camptothecin 1000 nM, Left: Fluorescent images (scale bar: 100 μm), Center: Enlarged images, Brightfield with outline of masks (blue: nucleus masks, red: cellular region masks), scale bar: 50 μm), Right: scatter plot of analysis results (X-axis : Nucleus area, Y-axis: Cell area). The cell area increased in wells treated with 1000 nM of camptothecin.
Fig .3: Analysis results of cell number and cell area (average), dose-response curve for camptothecin
(A) Bar graph (blue: cell number, orange: cell area per cell (average)), average cell area (orange) increased significantly in the wells with the drug concentration above 12.3 nM (columns 7-11). In addition, the number of cells (blue) was less compared to the control (column 2), and cell proliferation was suppressed. (B) Violin plot (cell area per cell (average)), The plate map view display allows intuitive confirmation of the drug reaction in each well. Numeric data can be viewed in the heatmap display and data table. (C) Dose-response curve showing a dose-dependent increase in cell area due to camptothecin, (X-axis: drug concentration (log), Y-axis: mean area per cell),EC50= 8.716 nM, Z’-factor = 0.64.
Camptothecin is an inhibitor of DNA topoisomerase I, an enzyme involved in DNA replication. Camptothecin inhibits functions related to cell division, such as DNA replication and tubulin depolymerization, so it suppresses cell proliferation and has antitumor activity. Therefore, cell division stops and the phenomenon of cell size increase is observed.
Conventional methods require many settings to optimize image acquisition and analysis conditions. Smart Experiment automates the process of image acquisition, analysis, and visualization, greatly reducing the number of manually-selected settings and optimization steps.
Smart Experiment is equipped with "CellFinder.ai“, which uses AI to find the optimal focal plane by autofocus settings that otherwise require advanced human judgment. This process is simple only selecting the Experiment icon and input the sample (drug) information is required. This easy-to-use software allows even first-time users to learn how to operate it in a short time.
| Cell Culture | |
|---|---|
| Cell Line | HeLa (RIKEN RCB0007) |
| Growth medium | MEM + 10%FBS + 1%Pc/Sm |
| Culture vessel | EZVIEW® Culture Plate B (Glass Bottom Plate) Microplate 96 well (AGC techno glass (IWAKI), 5866-096) |
| Test substance | |
|---|---|
| Compound | Camptothecin |
| Test concentration | Negative control: 0 nM
Positive control: 333 nM To make a dose-response curve, design required concentration points as follows: Ex: (0) 0 nM, (1) 0.152 nM, (2) 0.457 nM, (3) 1.41 nM, (4) 4.11 nM, (5) 12.3 nM, (6) 37 nM, (7) 111 nM, (8) 333 nM, (9) 1000 nM |
| Plate map example | 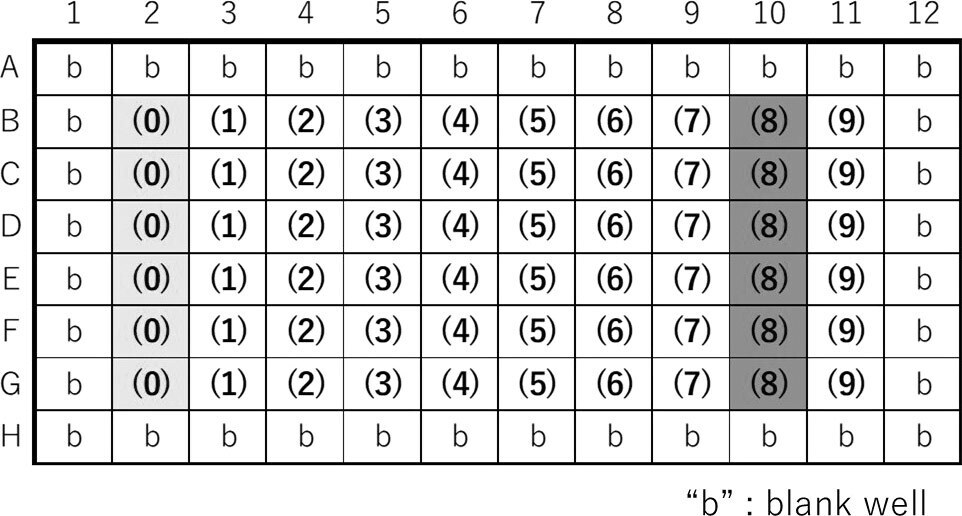 |
| Reagents | ||
|---|---|---|
| Product name | Product number | Supplier |
| (S)-(+)-Camptothecin, >=90% (HPLC), powder | C9911 | Sigma-Aldrich |
| -Cellstain®- Hoechst 33342 solution | H342 | Dojindo Laboratories |
| CellMaskTM Deep Red Plasma Membrane Stain | C10046 | Thermo Fisher Scientific,
InvitrogenTM |
| MEM (Minimum Essential Medium) | 11095080 | Thermo Fisher Scientific |
| Fetal bovine serum (FBS) | 10437028 | Thermo Fisher Scientific |
| Penicillin-Streptomycin (Pc/Sm) (10,000 U/ml) | 15140122 | Thermo Fisher Scientific |
| 16%-Paraformaldehyde Aqueous Solution (16% PFA)
*Dilute by 4% with PBS before use |
11850-14 | Nacalai Tesque |
| Dimethyl sulfoxide (DMSO) | 276855 | Sigma-Aldrich |
□ Compatible vessel*
*Compatible with glass and polystyrene bottom well plates. If image quality is a priority, use glass-bottom well plates.
Futamura, Y, et al., Morphobase, an Encyclopedic Cell Morphology Database, and Its Use for Drug Target Identification. Chemistry & Biology 19 1620-1630 (2012)
Smart Imaging System ECLIPSE Ji
ECLIPSE Ji is an AI-Driven, fully automated imaging system. By using it in combination with NIS-Elements SE, image acquisition, analysis, and graph creation can be run seamlessly and automatically. It is equipped with "CellFinder.ai“, which uses AI to find the optimal focal plane in autofocus settings that normally require advanced human judgment. Various trained AIs are implemented in the image acquisition and analysis process. This greatly reduces the number of steps for setting and optimization and makes it easier for everyone to get results.
Imaging Software NIS-Elements SE
SmartExperiment Basic Set
Size & Morphological analysis


