Nikon Instruments Inc. | Americas
- en Change Region
- Global Site
March 2026
Mechanical interactions play an important role in virtually all biological processes, from cell division to cell migration and development. Mechanical forces are generated by motor proteins and transmitted by the cytoskeleton to different mechanoreceptors that can sense and convert forces into diverse biochemical pathways such as T cell activation and platelet activation.1,2 In contrast to our detailed understanding of how chemical signals are transduced by cells, we are still in the dark ages when it comes to understanding mechano-transduction. Part of the challenge is that measuring forces in biology remains very difficult, as these forces are in the range of piconewtons – one billionth the weight of a paperclip – and highly transient. Because of this, tools to measure forces at the molecular scale are very limited.
Currently, the most widely used method to quantify cell forces is Traction Force Microscopy (TFM), which requires culturing cells on a deformable gel substrate embedded with fluorescent beads. The displacement of these beads following a mechanical interaction reveals the magnitude and direction of cellular traction forces. However, TFM requires extensive data processing to reconstruct cellular force maps and only reads out ensemble forces with micrometer spatial resolution, which averages the forces from hundreds or thousands of receptors. This is a problem, as mechano-transduction is mediated by mechanical interactions of individual receptors at piconewton levels.
To advance our understanding of cellular forces on the molecular scale, Dr. Khalid Salaita, a Samuel Candler Dobbs Professor of Chemistry at Emory University, pioneered the development of molecular tension probes. These probes have been instrumental in studying chemo-mechanical interactions in cell adhesions. Unlike TFM, these probes allow us to record interactions at individual ligand-receptor pairs, thereby providing precise force information at the molecular scale. This application note presents an example of molecular-scale mechanical force imaging and its automated data processing.
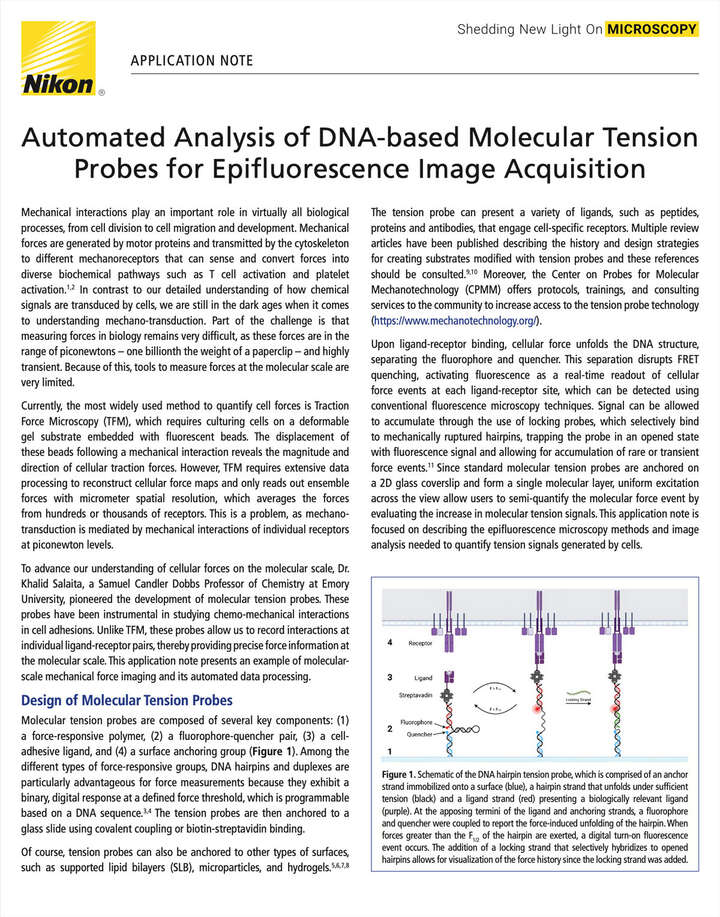
Figure 1. Schematic of the DNA hairpin tension probe, which is comprised of an anchor strand immobilized onto a surface (blue), a hairpin strand that unfolds under sufficient tension (black) and a ligand strand (red) presenting a biologically relevant ligand (purple). At the apposing termini of the ligand and anchoring strands, a fluorophore and quencher were coupled to report the force-induced unfolding of the hairpin. When forces greater than the F1/2 of the hairpin are exerted, a digital turn-on fluorescence event occurs. The addition of a locking strand that selectively hybridizes to opened hairpins allows for visualization of the force history since the locking strand was added.
Molecular tension probes are composed of several key components: (1) a force-responsive polymer, (2) a fluorophore-quencher pair, (3) a cell-adhesive ligand, and (4) a surface anchoring group (Figure 1). Among the different types of force-responsive groups, DNA hairpins and duplexes are particularly advantageous for force measurements because they exhibit a binary, digital response at a defined force threshold, which is programmable based on a DNA sequence.3,4 The tension probes are then anchored to a glass slide using covalent coupling or biotin-streptavidin binding.
Of course, tension probes can also be anchored to other types of surfaces, such as supported lipid bilayers (SLB), microparticles, and hydrogels.5,6,7,8 The tension probe can present a variety of ligands, such as peptides, proteins and antibodies, that engage cell-specific receptors. Multiple review articles have been published describing the history and design strategies for creating substrates modified with tension probes and these references should be consulted.9,10 Moreover, the Center on Probes for Molecular Mechanotechnology (CPMM) offers protocols, trainings, and consulting services to the community to increase access to the tension probe technology (https://www.mechanotechnology.org/).
Upon ligand-receptor binding, cellular force unfolds the DNA structure, separating the fluorophore and quencher. This separation disrupts FRET quenching, activating fluorescence as a real-time readout of cellular force events at each ligand-receptor site, which can be detected using conventional fluorescence microscopy techniques. Signal can be allowed to accumulate through the use of locking probes, which selectively bind to mechanically ruptured hairpins, trapping the probe in an opened state with fluorescence signal and allowing for accumulation of rare or transient force events.11 Since standard molecular tension probes are anchored on a 2D glass coverslip and form a single molecular layer, uniform excitation across the view allow users to semi-quantify the molecular force event by evaluating the increase in molecular tension signals. This application note is focused on describing the epifluorescence microscopy methods and image analysis needed to quantify tension signals generated by cells.
Figure 2. Automated analysis of tension signal using GA3.
A) GA3 routine graphical overview. Analysis is split into 4 sections: Preprocessing, Data Management, Cell ROI analysis, and Visualization. B) Plot of cell tension signals for five cells shown in C. C) Time series images of tension signal for 5 cells.
Molecular tension probes are anchored on a 2D glass coverslip and present a peptide-major histocompatibility complex (pMHC) ligand. After probe anchoring, mouse CD8+ T cells are seeded onto the probe-coated glass coverslip in HBSS media. Following 15 minutes of culture at room temperature, the locking strand (200 nM) is added, and timelapse images of the Cy3B fluorescence signal (TRITC cube) was acquired using EMCCD camera (ANDOR, iXon Ultra) mounted on Nikon Ti2-E system with a CFI Apochromat TIRF 100XC Oil (NA 1.49) objective.
Quantifying force can be straightforward here: it involves measuring fluorescence (I) intensity and comparing it to the maximum (𝐼𝑒) and minimum (𝐼𝑓) intensities (Equation 1):

This calculation is carried out in Figure 2, where a General Analysis routine is shown in Fig 2A. The resulting tension signal (Fig 2B), shows a steadily increasing tension signal throughout the duration of the experiment.
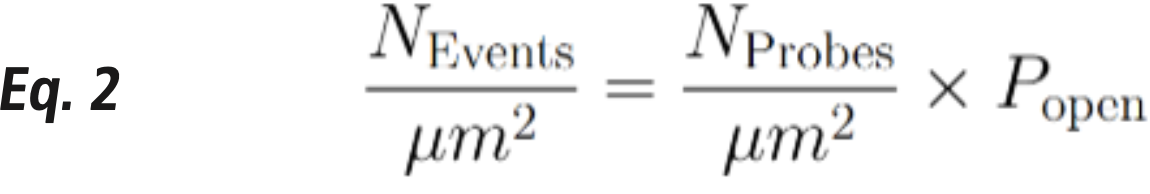
To further enhance quantification, dye-doped SLB can create variable fluorophore densities (fluorophores / µm2 ) on the 2D surface, establishing a relationship between fluorescence intensity and the number of fluorophores. This calibration enables the estimation of probe density on the glass surface. By combining this information with the percentage of open probes (𝑃_𝑜𝑝𝑒𝑛), the frequency of probe opening events at ligand-receptor pairs can be inferred at each cell adhesion site (Equation 2). These probe opening events are indicators of the force events at the ligand-receptor pairs that exceed the probe’s force threshold.
After image processing, cell-generated force events are evaluated or quantified, often in terms of the mean force events per cell or total force events per cell. Additionally, the spatial and temporal relationships between mechanical events and signaling events provide invaluable insights into cell signaling. These relationships can be investigated using a combination of GFP-tagged proteins of interest (POIs) and tension probes labeled with red or far-red fluorophores. However, potential sources of misevaluation of tension signal must be considered, including: (1) photobleaching of fluorescent dyes used in tension probes and (2) damage to probes caused by cell-generated nuclease activity. To address these challenges, several strategies have been developed, such as employing dyes with high resistance to photobleaching, applying data processing techniques to correct for photobleaching, and using modified nucleic acid probes that are resistant to nuclease activity.
Figure 3. Use of SegmentObjects.ai for automatic segmentation of cells using RICM signal.
A) Raw and manually segmented RICM images. B) Training SegmentObjects.AI using images and binaries from A. This plot shows the loss function as a function of iterations. C) Application of trained model to new dataset.
Reflection interference contrast microscopy (RICM) is a microscopy technique that reports on the proximity of an object to the glass surface.12 The object is illuminated by linearly polarized light which is partially reflected at the glass interface, creating the reference beam. The light transmitted through the coverslip, upon interacting with high-refractive index objects like cell membranes closer to the glass will be phase shifted up to δ = π, leading to out-of-phase reflection of the light.13 This destructive interference with the light reflected at the glass interface causes dark pixels where an object is close to the glass, and bright pixels where there is constructive interference.14 This technique can be used in live cell imaging to identify cell-glass substrate interactions, their movement over time, and the relative distance between different parts of a cell and the glass surface. The Ti2-E is an ideal instrument for performing RICM imaging, as it is easily configured for these types of experiments.
Despite the benefits of this technique, the undular surface typical to cells are difficult to automatically segment, since the cellular periphery is often more strongly attached than the interior, leading to many incorrectly segmented objects. For manual segmentation, analyzing larger numbers of cells are preferable, but this process is time consuming and user-dependent, and bias in experimenter analysis can contribute to different segmentation decisions between analyzers, decreasing consistency.
Molecular tension probes are anchored on a 2D glass coverslip and present a peptide-major histocompatibility complex (pMHC) ligand. After probe anchoring, mouse CD8+ T cells are seeded onto the probe-coated glass coverslip in HBSS media. Following 15 minutes of culture at room temperature, the locking strand (200 nM) is added, and timelapse images of the Cy3B fluorescence signal (TRITC cube) was acquired using an EMCCD camera (ANDOR, iXon Ultra) mounted on Nikon Eclipse Ti2-E system with a CFI Apochromat TIRF 100XC Oil (NA 1.49) objective.
After acquisition, 10 sample images are manually labeled using the binary editor to indicate cell adhesion points in the RICM channel (Fig 2A). The raw and binary images are then used to train a model using SegmentObjects.ai for ~30 epochs (Fig 2B). Fig 2C shows a RICM image that was not included in the training data, with the labeled RICM signal in pink. The trained model is able to reliably threshold the RICM signal with minimal user interaction after training is complete.
Quantification of cell tension and adherence signals is typically a manual and time-consuming process. Utilizing automated analysis techniques such as GA3 and NIS.ai modules enables both rapid and repeatable analysis. While GA3 enables the user to fully customize the analytical pipeline, NIS.ai modules such as SegmentObjects.ai allow for nuanced signals (e.g. when performing label-free imaging) to be reliably recovered where traditional methods may fail to generalize.
ECLIPSE Ti2-E Inverted Motorized Microscope
Unparalleled performance with advanced automation, ideal for live-cell, confocal, superresolution, and high-content imaging applications.


