Nikon Europe B.V. | Europe & Africa
- en Change Region
- Global Site
October 2023
Accurately capturing changes in cellular signaling pathways due to drug addition is essential for target discovery and mechanistic characterization of new drugs. Many signaling pathways are regulated through the localization of proteins into intracellular compartments such as cell membrane lipid rafts, scaffold proteins, and nuclei. Recently, it has been discovered that protein droplets formed by liquid-liquid phase separation are involved in signal enhancement and branching. Observing protein localization patterns is a key component of elucidating the modes of action of new drugs and compounds, but conventional biochemical analysis does not provide adequate spatial information. In contrast, microscopy enables detailed quantification of the spatiotemporal behavior of signaling proteins. Nikon leverages these capabilities to provide a new service that estimates signaling pathways activated in cells based only on microscopy images. We call this method PLOM-CON*1. In this paper, we present an example of applying this method to analyze insulin signaling pathways.
Keywords: drug discovery, signaling pathway, localization, liquid-liquid phase separation, droplet, protein condensates, organelle, microscopeimages
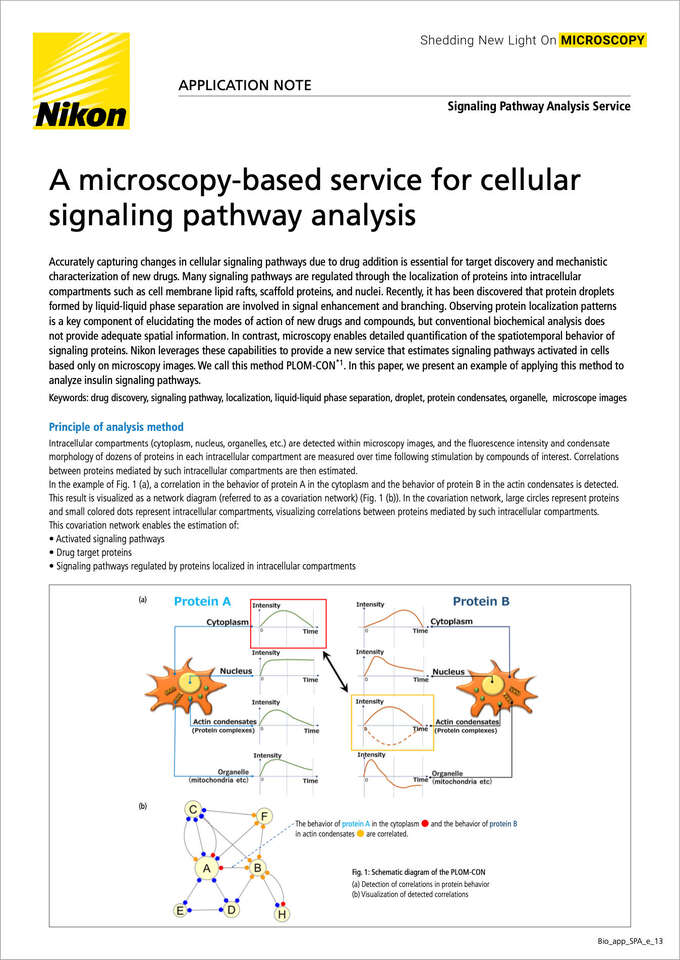
Intracellular compartments (cytoplasm, nucleus, organelles, etc.) are detected within microscopy images, and the fluorescence intensity and condensate morphology of dozens of proteins in each intracellular compartment are measured over time following stimulation by compounds of interest.Correlations between proteins mediated by such intracellular compartments are then estimated.
In the example of Fig. 1 (a), a correlation in the behavior of protein A in the cytoplasm and the behavior of protein B in the actin condensates is detected. This result is visualized as a network diagram (referred to as a covariation network) (Fig. 1 (b)). In the covariation network, large circles represent proteins and small colored dots represent intracellular compartments, visualizing correlations between proteins mediated by such intracellular compartments.
This covariation network enables the estimation of:
Fig. 1: Schematic diagram of the PLOM-CON
(a) Detection of correlations in protein behavior
(b) Visualization of detected correlations
■ Background
Insulin-stimulated H4II EC3 cells (a rat liver cancer-derived cultured cell) are known to transiently form actin condensates colocalized with various signaling proteins (Fig. 2). It is difficult to biochemically purify these actin condensates, therefore their intracellular functions have not been elucidated. However, since it is possible to accurately quantify actin condensates via microscopy, we applied the PLOM-CON method to analyze how actin condensates function in insulin signaling pathways.
Fig. 2: Co-localization of Akt (pSer473) and actin condensates
(a) Confocal image of actin condensates
Actin condensates are formed transiently after insulin stimulation (right, yellow arrows).
(b) Super resolution image of actincondensates
Localization of Akt (pSer473) within actin condensates.
Red: Actin, Green: Akt (pSer473)
Acquired with an N-SIM super-resolution microscope. Scale bar: 5 µm
Source: Noguchi et al., iScience 24,102724, 2021
■ Generation of covariation networks
We selected 50 proteins from insulin signaling pathways, and estimated covariation networks after insulin stimulation with respect to two conditions of the actin polymerization inhibitor CK666 (-) and (+).
Fig. 3 (a) shows the covariation network of CK666(-).
■ Estimation of active signaling pathways
In the covariation network of CK666(-) (Fig. 3 (a)), the edges between the proteins related to blood glucose regulation during insulin stimulation were dense (blue frame in Fig. 3 (a)).
This suggested that the signaling pathways indicated by the red arrow in the insulin response network (Fig. 3 (b)) were activated.
Activation of this pathway was confirmed by measuring a ¼ attenuation in expression level of G6PC, while the level of glycogen synthesis increased 3 times.
Fig. 3: The covariation network of CK666(-)
(a) The covariation network
Intracellular compartments: ● ; Actincondensates ● ; Nucleus ● ; Cytoplasm
The edges between the proteins related to blood glucose regulation during insulin stimulation were dense.
(b) Activated signaling pathways
This is a schematic diagram of a known insulin signaling pathways. Among them, red arrows indicate pathways that are suggested to be activated
■ Role of actin condensates
In the covariation network of CK666(-), GSK3β(pSer9) was active only within actin condensates (Fig. 3 ①), and through the condensates had relationship with Akt (pSer473) (Fig. 3 ②). On the other hand, FoxO1 (pSer256) and Akt (pSer473) were related in the nucleus (Fig. 3 ③). These findings suggest that the glycogen synthesis pathway in the insulin response network is regulated in actin condensates (Fig. 3④). When we actually inhibited actin condensate formation with CK666, the following biochemical analysis results were obtained.
A) Insulin-stimulated glycogen synthesis was inhibited.From these results, it was confirmed that the pathway of glycogen synthesis wasregulated in actin condensates. Actincondensates are suggested protein complexes transiently formed by liquid-liquid phase separation. Thus, by using this analysis method, it is possible to understand how the signaling pathway is regulated by protein complexes or droplets.
■ Drug-induced signaling pathway modulation
Next, we compared the covariation networks of CK666 (-) and (+). As mentioned above, in CK666(-), blood glucose regulation pathways were activated, while in CK666(+), the edges between proteins that constitute the signaling pathway for protein synthesis regulation were dense (blue frame in Fig. 4 (a)). This result suggests that the signaling pathways changed from blood glucose regulation to protein synthesis regulation with the drug (Fig. 4 (b)).
Fig. 4: The covariation network of CK666(+)
(a)The covariation network
Intracellular compartments : ● ; Nucleus ● ; Cytoplasm
The edges between the proteins related to protein synthesis regulation during insulin stimulation were dense.
(b) Suggested changes in signaling pathways by CK666
This is a schematic diagram of a known insulin signaling system.
Red arrows: Pathways suggested to be activated by CK666(-) (see Fig. 3 (a))
Blue arrow: A pathway suggested to be activated by CK666(+) from the results of Fig. 4 (a)
The "Signaling Pathway Analysis Service“ provided by Nikon estimates relationships between proteins mediated by localization into organelles, droplets or protein complexes. With this method, the role of actin condensates in the insulin signaling network was elucidated.
The “Signaling Pathway Analysis Service” can be applied to elucidate the mode of action of drugs and disease mechanisms, etc., and can contribute to improving research efficiency in the fields of drug discovery, medical careand life science.
Noguchi et al., iScience 24,102724, 2021
Yoshiyuki Noguchi,1 Fumi Kano,2 Nobuhiko Maiya,3 Chisako Iwamoto,3 Shoko Yamasaki,3Yosuke Otsubo,3 Daiki Nakatsu,2 Rina Kunishige,1,2 and Masayuki Murata1,2,*
1 Department of Life Sciences, Graduate School of Arts and Sciences, The University of Tokyo, 2 Cell Biology Center, Institute of Innovative Research, Tokyo Institute of Technology, 3 Nikon Corporation
*1 PLOM-CON (Protein Localization and Modification-based Covariation Network analysis method):
PLOM-CON was developed by the following individuals and Nikon Corporation.
Associate Professor Fumi Kano , Assistant Professor Taiki Nakatsu, Specially Appointed Assistant Professor Rina Kunishige of the Cell Biology Center, Institute of Innovative Research, Tokyo Institute of Technology, Professor Masayuki Murata of the Graduate School of Arts and Sciences, the University of Tokyo (currently Specially Appointed Professor of the Tokyo Institute of Technology, Director of the Multimodal Cell Analysis Collaborative Research Cluster, Institute of Innovative Research, Tokyo Institute of Technology, Professor Emeritus of the University of Tokyo), Assistant Professor Yoshiyuki Noguchi of the Graduate School of Arts and Sciences, the University of Tokyo (currently IRCN of the University of Tokyo).
Signaling Pathway Analysis Service
Nikon acquires microscopy images of customers’ cells with the best acquisition conditions for image analysis, and quantify behavior of proteins in various intracellular compartments. By estimating inter-protein correlations, Nikon can visualize the signaling pathways as a network diagram, including information on intracellular localization, such as “Protein A in the cytoplasm and protein B in the nucleus have a strong correlation”. This makes it possible to estimate correlations between proteinsmediated by such intracellular compartments or protein condensates, which are difficult to understand with conventional biochemical analysis. This service can provide data equivalent to approximately 300 Western blotting experiments, providing powerful support for drug mode of action and target characterization.


