Nikon Europe B.V. | Europe & Africa
- fr Change Region
- Global Site
septembre 2023
ECLIPSE Ji with Smart Experiment software enables seamless operation from image acquisition to analysis and graph creation. Pre-trained Artificial Intelligence (AI) and pre-defined imaging processes automatically optimize image acquisition and analysis condition settings, providing visualized data and EC50 information with simple operation. Fluorescence intensity measurement is used in a wide range of applications, from basic research of cell biology to drug discovery, including quantification of protein and enzyme activity. This application note introduces an example of using the Intensity Measurement module of Smart Experiment to detect cell regions label-free from brightfield images and measure the fluorescence intensity at the cellular level. We also present an example of quantifying the drug’s effect by automatically visualizing the dose-dependent decrease in fluorescence intensity derived from pMAPK and calculating the IC50.
Keywords: fluorescence intensity, protein quantification, drug discovery, anticancer drug research, automatic setting, IC50, dose-response curve
(1) HeLa cells were seeded in 96-well plates and cultured for 24 hours. (2) The test substance U0126 was diluted to 10 different concentrations, added to each well and treated for 15 minutes. (3) Cells were transferred to growth medium containing each test concentration of U0126 and 10 ng/ml PMA and incubated for 15 minutes. (4) Cells were fixed with 4% PFA. Membrane permeabilization was performed with 0.2% Triton X-100. (5) Immunofluorescence staining was done with Rabbit anti pMAPK antibody and Goat anti-rabbit IgG H&L Alexa Fluor™ 488. Nuclei were stained with DAPI. (6) The well plate was placed on ECLIPSE Ji and image acquisition and analysis was run automatically by selecting the Intensity Measurement icon.
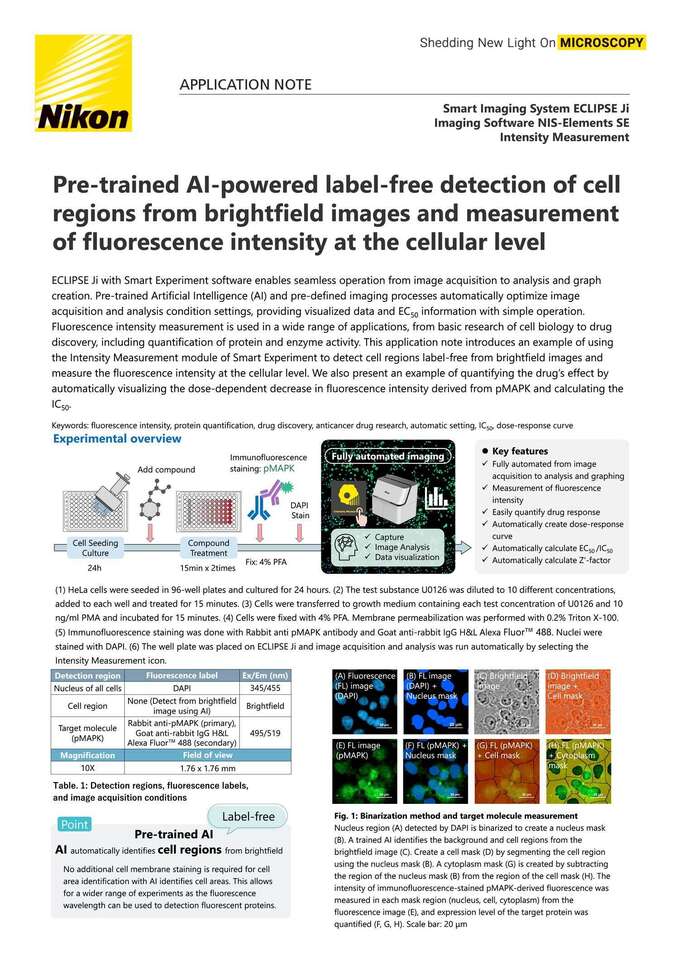
Fig. 1: Binarization method and target molecule measurement
Nucleus region (A) detected by DAPI is binarized to create a nucleus mask (B). A trained AI identifies the background and cell regions from the brightfield image (C). Create a cell mask (D) by segmenting the cell region using the nucleus mask (B). A cytoplasm mask (G) is created by subtracting the region of the nucleus mask (B) from the region of the cell mask (H). The intensity of immunofluorescence-stained pMAPK-derived fluorescence was measured in each mask region (nucleus, cell, cytoplasm) from the fluorescence image (E), and expression level of the target protein was quantified (F, G, H). Scale bar: 20 μm
Fig. 2: Fluorescence intensity measurement results, Software with easy-to-analyze GUI
Heatmaps, bar graphs, boxplots, and violin plots displays in the plate map view allow you to intuitively confirm the analysis results for the entire plate. The data table provides well-level (C) and single-cell level (D) information. Dose-response curves, scatter plots, histograms, and bar graphs can be displayed. The bar graph (A) in the plate map view shows a drug concentration-dependent decrease in the mean pMAPK-derived fluorescence intensity in the nuclear, cellular, and cytoplasmic masked regions. In this experiment, the IC50 based on pMAPK-derived fluorescence intensity in the cell mask region was 1.665. Scale bar: 200 μm
Fig. 3: Images of control (untreated) and HeLa cells treated with U0126 for 30 minutes, masks overlaid on fluorescence image
Enlarged image created by opening the image file in advanced mode and cropping the area of the orange dotted frame (0.31 mm × 0.31 mm) in Fig. 2. Upper row: control (untreated), lower row: treated with U0126 10 μM for 24 hours, (A) Merged image of brightfield and fluorescence (green: pMAPK) overlaid with mask outline (blue: nucleus mask, red: cell mask), (B) Immunofluorescence image of pMAPK, (C-E) Fluorescence image (green: pMAPK) overlaid with each mask, (C) blue: nucleus mask, (D) red: cell mask, (E) yellow: cytoplasm mask , Scale bar: 50 μm
Compatible vessel*
・ 24, 48, 96 well plate
*Compatible with glass and polystyrene bottom well plates. If image quality is a priority, use glass-bottom well plates.
Favata, MF, et al., Identification of a Novel Inhibitor of Mitogen-activated Protein Kinase Kinase Journal of Biological Chemistry 273 18623-18632 (1998)
Smart Imaging System ECLIPSE Ji
ECLIPSE Ji is an AI-Driven, fully automated imaging system. By using it in combination with NIS-Elements SE, image acquisition, analysis, and graph creation can be run seamlessly and automatically. It is equipped with "CellFinder.ai“, which uses AI to find the optimal focal plane in autofocus settings that normally require advanced human judgment. Various trained AIs are implemented in the image acquisition and analysis process. This greatly reduces the number of steps for setting and optimization and makes it easier for everyone to get results.
Imaging Software NIS-Elements SE
Smart Experiment Basic Set
Intensity Measurement


