Nikon Instruments Inc. | Americas
- es Change Region
- Global Site
enero 2026
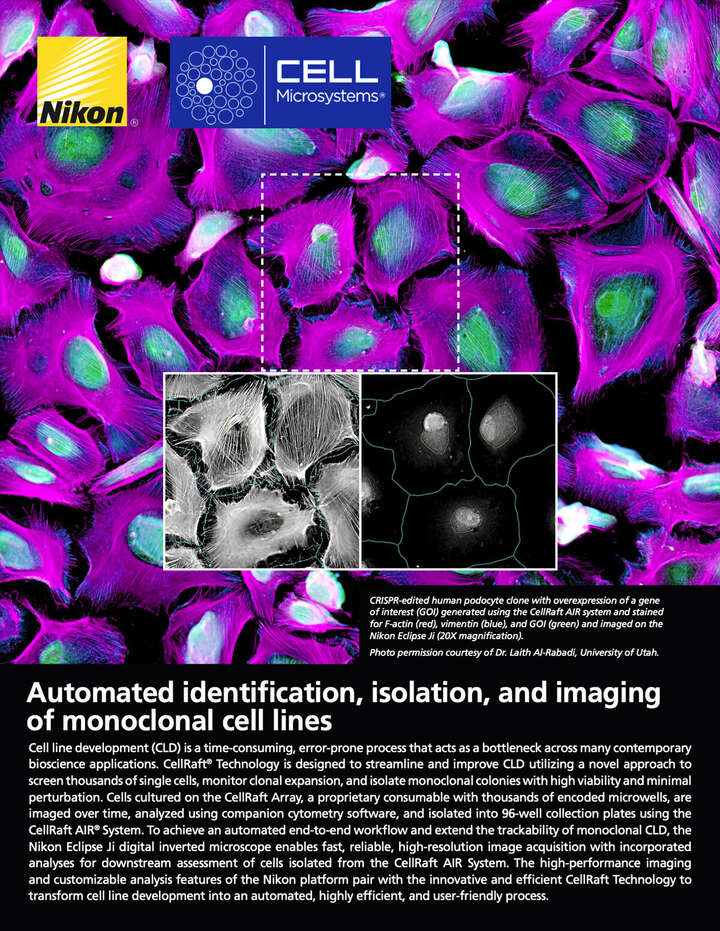
Cell line development (CLD) is a time-consuming, error-prone process that acts as a bottleneck across many contemporary bioscience applications. CellRaft® Technology is designed to streamline and improve CLD utilizing a novel approach to screen thousands of single cells, monitor clonal expansion, and isolate monoclonal colonies with high viability and minimal perturbation. Cells cultured on the CellRaft Array, a proprietary consumable with thousands of encoded microwells, are imaged over time, analyzed using companion cytometry software, and isolated into 96-well collection plates using the CellRaft AIR® System. To achieve an automated end-to-end workflow and extend the trackability of monoclonal CLD, the Nikon ECLIPSE Ji digital inverted microscope enables fast, reliable, high-resolution image acquisition with incorporated analyses for downstream assessment of cells isolated from the CellRaft AIR System. The high-performance imaging and customizable analysis features of the Nikon platform pair with the innovative and efficient CellRaft Technology to transform cell line development into an automated, highly efficient, and user-friendly process.
Cell line development (CLD) is a critical process in biopharmaceutical production involving the isolation and expansion of single cells with desirable traits to generate stable, monoclonal cell lines. Traditional methods like limiting dilution and fluorescence- activated cell sorting (FACS) both rely on placing a single cell in a well for monoclonal expansion, which is highly inefficient even for the most robust cell lines due to the low viability of single cells. The unique design of the CellRaft Array enables thousands of cells to be cultured in a shared media reservoir where the cells can grow as effectively as they do in bulk culture, but with maintained spatial segregation as each cell sits on an encoded microscale polystyrene growth surface called a CellRaft (Figure 1A). Using the CellRaft AIR System, the array is serially imaged to capture a complete growth record of single cells as they form monoclonal colonies in the microwells (Figures 1B, C). CellRaft technology enables complete tracking and traceability of thousands of single cells while improving cell viability and monoclonal expansion by eliminating the need for fluidic manipulation or harsh single-cell culture methods. Using CellRaft Cytometry, software analysis tools enable users to identify CellRafts with their cells of interest at each timepoint, including algorithms to identify single cells, colonies, fluorescence intensity, and morphology characteristics. Once monoclonal colonies of interest are identified, the CellRaft AIR system performs the automated isolation of the CellRafts into 96-well collection plates for monoclonal expansion.
Figure 1: CellRaft Technology enables efficient cell line development workflows.(A) The CellRaft Array provides a unique culture environment where thousands of cells are grown in spatially segregated microwells while sharing contiguous media. (B) The CellRaft AIR System performs automated image-based screening and isolation of cells-of-interest grown on the CellRaft Array. CellRaft Technology enables monoclonal verification, and image-guided selection of monoclonal colonies for expansion. (C) Brightfield images of a single cell growing into a microcolony following isolation. Orange dotted line indicates transition from CellRaft isolation to 96-well plate culture and downstream imaging.
The CellRaft AIR System performs automated imaging of cells grown on the CellRaft Array in brightfield and 3-channel (blue, green, red) fluorescence. Using temporal image analysis, CellRaft Cytometry identifies monoclonal colonies using automated analysis algorithms for identifying single cells, dividing cells, and confluent colonies, all rooted in brightfield analysis (Figure 1C). In addition, users can employ fluorescent analysis tools, whether using fluorescently labeled cells, passive dyes, or antibody staining, to further interrogate heterogenous populations to isolate monoclonal colonies with their specific phenotype of interest (Figure 2).
Figure 2: Four types of fluorescent labeling and detection on the CellRaft Array. (A) CRISPR-edited fluorescently labeled cells; MB49< cells constitutively expressing mCherry. (B) Cell painting using passive dyes; A549 cells stained with (500nM) MitoTracker Red FM and (1:200) CellBrite Green membrane before seeding, then stained on the array with (2µg/mL) Hoechst 33342 staining solution. (C) Cell surface antibody staining; β-Actin tagged GFP iPSCs stained with (1:50) Anti-TRA-1-60 Alexa Fluor 594 and NucBlue Live Ready Probes nuclear stain (2 drops/mL). (D) Secreted antibody staining; Hybridoma cells cultured with anti-IgG-FITC antibody (5μg/mL) to identify rare antibody-secreting clones.
Regardless of the fluorescent labeling method, CellRaft Cytometry allows for nuanced fluorescent sorting on each individual CellRaft, including mean fluorescence and standard deviation of fluorescence in each CellRaft. This allows for comparisons in both average fluorescence levels and variation in fluorescent signal between CellRafts, enabling sorting of CellRafts based on various fluorescent signal types, which are useful for detecting variations in a population or finding rare fluorescent events. To demonstrate these capabilities, we co-cultured two heterogenous populations of MB49 cells, one expressing varying GFP and the other expressing varying mCherry on a CellRaft Array. A total of 50,000 cells were seeded on the array (25,000 cells per line). Using CellRaft Cytometry, we identified more than 5,200 monoclonal colonies altogether that could be further analyzed and mapped for isolation. The monoclonal colonies were analyzed and sorted based on fluorescence intensity (Figure 3A). Sixteen colonies of each phenotype were isolated into a 96-well collection plate for outgrowth and analysis (Figure 3B). Downstream imaging and analysis of monoclonal colonies was performed on the entire 96-well plate using the Nikon Eclipse Ji, thus creating a growth record of colonies post-isolation (Figure 3C).
Following isolation of monoclonal cell lines and transfer to a 96-well plate, the growth and expression levels of each colony of interest were monitored over the course of multiple days. Within the NIS-Elements software, a protocol was created that would automatically image the entire 96-well plate and measure a variety of statistical parameters such as total well coverage and mean colony fluorescence in multiple channels. At each timepoint, each well of the plate harboring 16 representatives from varying fluorescent protein expression level groups (Figure 4A) was imaged and a whole-plate overview image was produced to allow easy monitoring of continued experimental fidelity (Figure 4B). Automated
Figure 3. Isolating monoclonal colonies based on fluorescent phenotype. (A) Sorting parameters of monoclonal colonies based on mean fluorescent intensity. (B) Plate map of sixteen CellRafts of each colony phenotype (red- bright red, purple- mid red, blue- dim red, green- bright green, yellow- mid green, light blue- dim green) isolated using the CellRaft AIR System. (C) Brightfield and fluorescence images tracking a monoclonal colony expressing a moderate amount of mCherry captured on the CellRaft AIR (days 0-2) and the Nikon Eclipse Ji (days 2-10).
analysis for fluorescence intensity makes it easy to observe drift, or aberrant fluorescent expression, as the monoclonal colonies expand. The relative fluorescent expression levels were also visualized as heat maps (Figure 4C). For each well, the colony is segmented using an AI model trained to detect confluent cells in brightfield without the use of transmitted contrasting techniques (Figure 4D, E). All measurements performed within the automated protocol can either be summarized and plotted directly within Elements or exported as a CSV file for additional statistical analyses. Here, we display the mean and standard deviation of colony fluorescence within each group of 16 representatives (Figure 4F). Together, these analyses support the phenotypic selection of colonies using the CellRaft AIR System and provide a complete imaging and analytical record of monoclonal expansion.
Figure 4. Downstream imaging and analyses of isolated cell lines with NIS-Elements and Eclipse Ji. (A) Plate map of isolated monocolonies. (B) Brightfield, GFP, and mCherry plate overview images. The blue square indicates the well depicted in panel D. (C) Heat map visualization of the mean colony fluorescence of GFP (left) and mCherry (right). (D) Overview of the indicated colony in the well plate view, selected for high expression of GFP. (E) Zoomed in view of the colony in panel D indicating the binary mask over the auto-detected colony area. (F) Mean and standard deviation of colony fluorescence, grouped by initial selection condition (low, medium, and high expression of GFP or mCherry).
Maintaining an end-to-end chain of custody from a single cell proliferating into a microcolony is not a trivial problem. Pairing the powerful CellRaft Technology for culturing, identifying, and isolating monoclonal cells of interest with automated imaging and analysis workflows, powered by the Eclipse Ji with NIS-Elements enables the collection of an unbroken monoclonal history that provides new insights and validation for a wide variety of biological and pharmaceutical research.
The CellRaft AIR System transforms single-cell workflows by solving the biggest pain point in cell line development: growing viable monoclonal colonies. Unlike traditional methods, CellRaft Technology tracks each cell’s journey — from single cell to clonal colony — with automated imaging, phenotypic analysis, and gentle isolation.
Learn more at cellmicrosystems.com/cellraft-air-systems
The Eclipse Ji is a benchtop, research-grade digital microscope featuring built-in automated acquisition and analysis routines for a variety of cellular studies, and is customizable with specialized optics, confocal capability, and more. NIS-Elements software enables the creation of automated acquisition and analysis routines via an intuitive graphical programming interface in order to accomplish your specific research goals.


