Nikon Instruments Inc. | Americas
- es Change Region
- Global Site
septiembre 2023
ECLIPSE Ji with Smart Experiment software enables seamless experiments from image acquisition to analysis and graph creation. Pre-trained Artificial Intelligence (AI) and pre-defined imaging processes automatically optimize image acquisition and analysis settings, providing visualized data and EC50 information with simple operation. The transcription factor NF-κB is widely known as a drug target for cancer and inflammatory diseases. Activated NF-κB translocates from the cytoplasm to the nucleus and induces the expression of disease-related genes. This application note introduces an example of using the Nuclear Translocation module of Smart Experiment to quantify the TNF-α-stimulated NF-κB translocation from the cytoplasm to the nucleus.
Keywords: nuclear translocation, signaling pathway, anticancer drug, anti-inflammatory, automatic setting, EC50, dose-response curve
(1) HeLa cells were seeded in 96-well plates and cultured for 24 hours. (2) The test substance TNF-α was diluted to 10 different concentrations and added to each well and treated for 30 minutes. (3) Cells were fixed with 4% PFA. Membrane permeabilization was induced with 0.1% Triton X-100. (4) Immunofluorescence staining included Rabbit anti NF-κB p65 antibody and Goat Anti-Rabbit IgG H&L (Alexa Fluor® 488). Nuclei were stained with DAPI. (5) The well plate was placed on ECLIPSE Ji and image acquisition and analysis was run automatically by selecting the Nuclear Translocation analysis icon.
| Detection region | Fluorescence label | Ex/Em (nm) |
|---|---|---|
| Nucleus region | DAPI | 345/455 |
| Target protein | Rabbit anti NF-KB p65 antibody (primary), Goat Anti-Rabbit IgG H&L (Alexa Fluor@ 488) (secondary) | 495/519 |
| Magnification | Field of view | |
| 20X | 0.88 × 0.88 mm | |
Table. 1: Detection regions, fluorescence labels, and image acquisition conditions
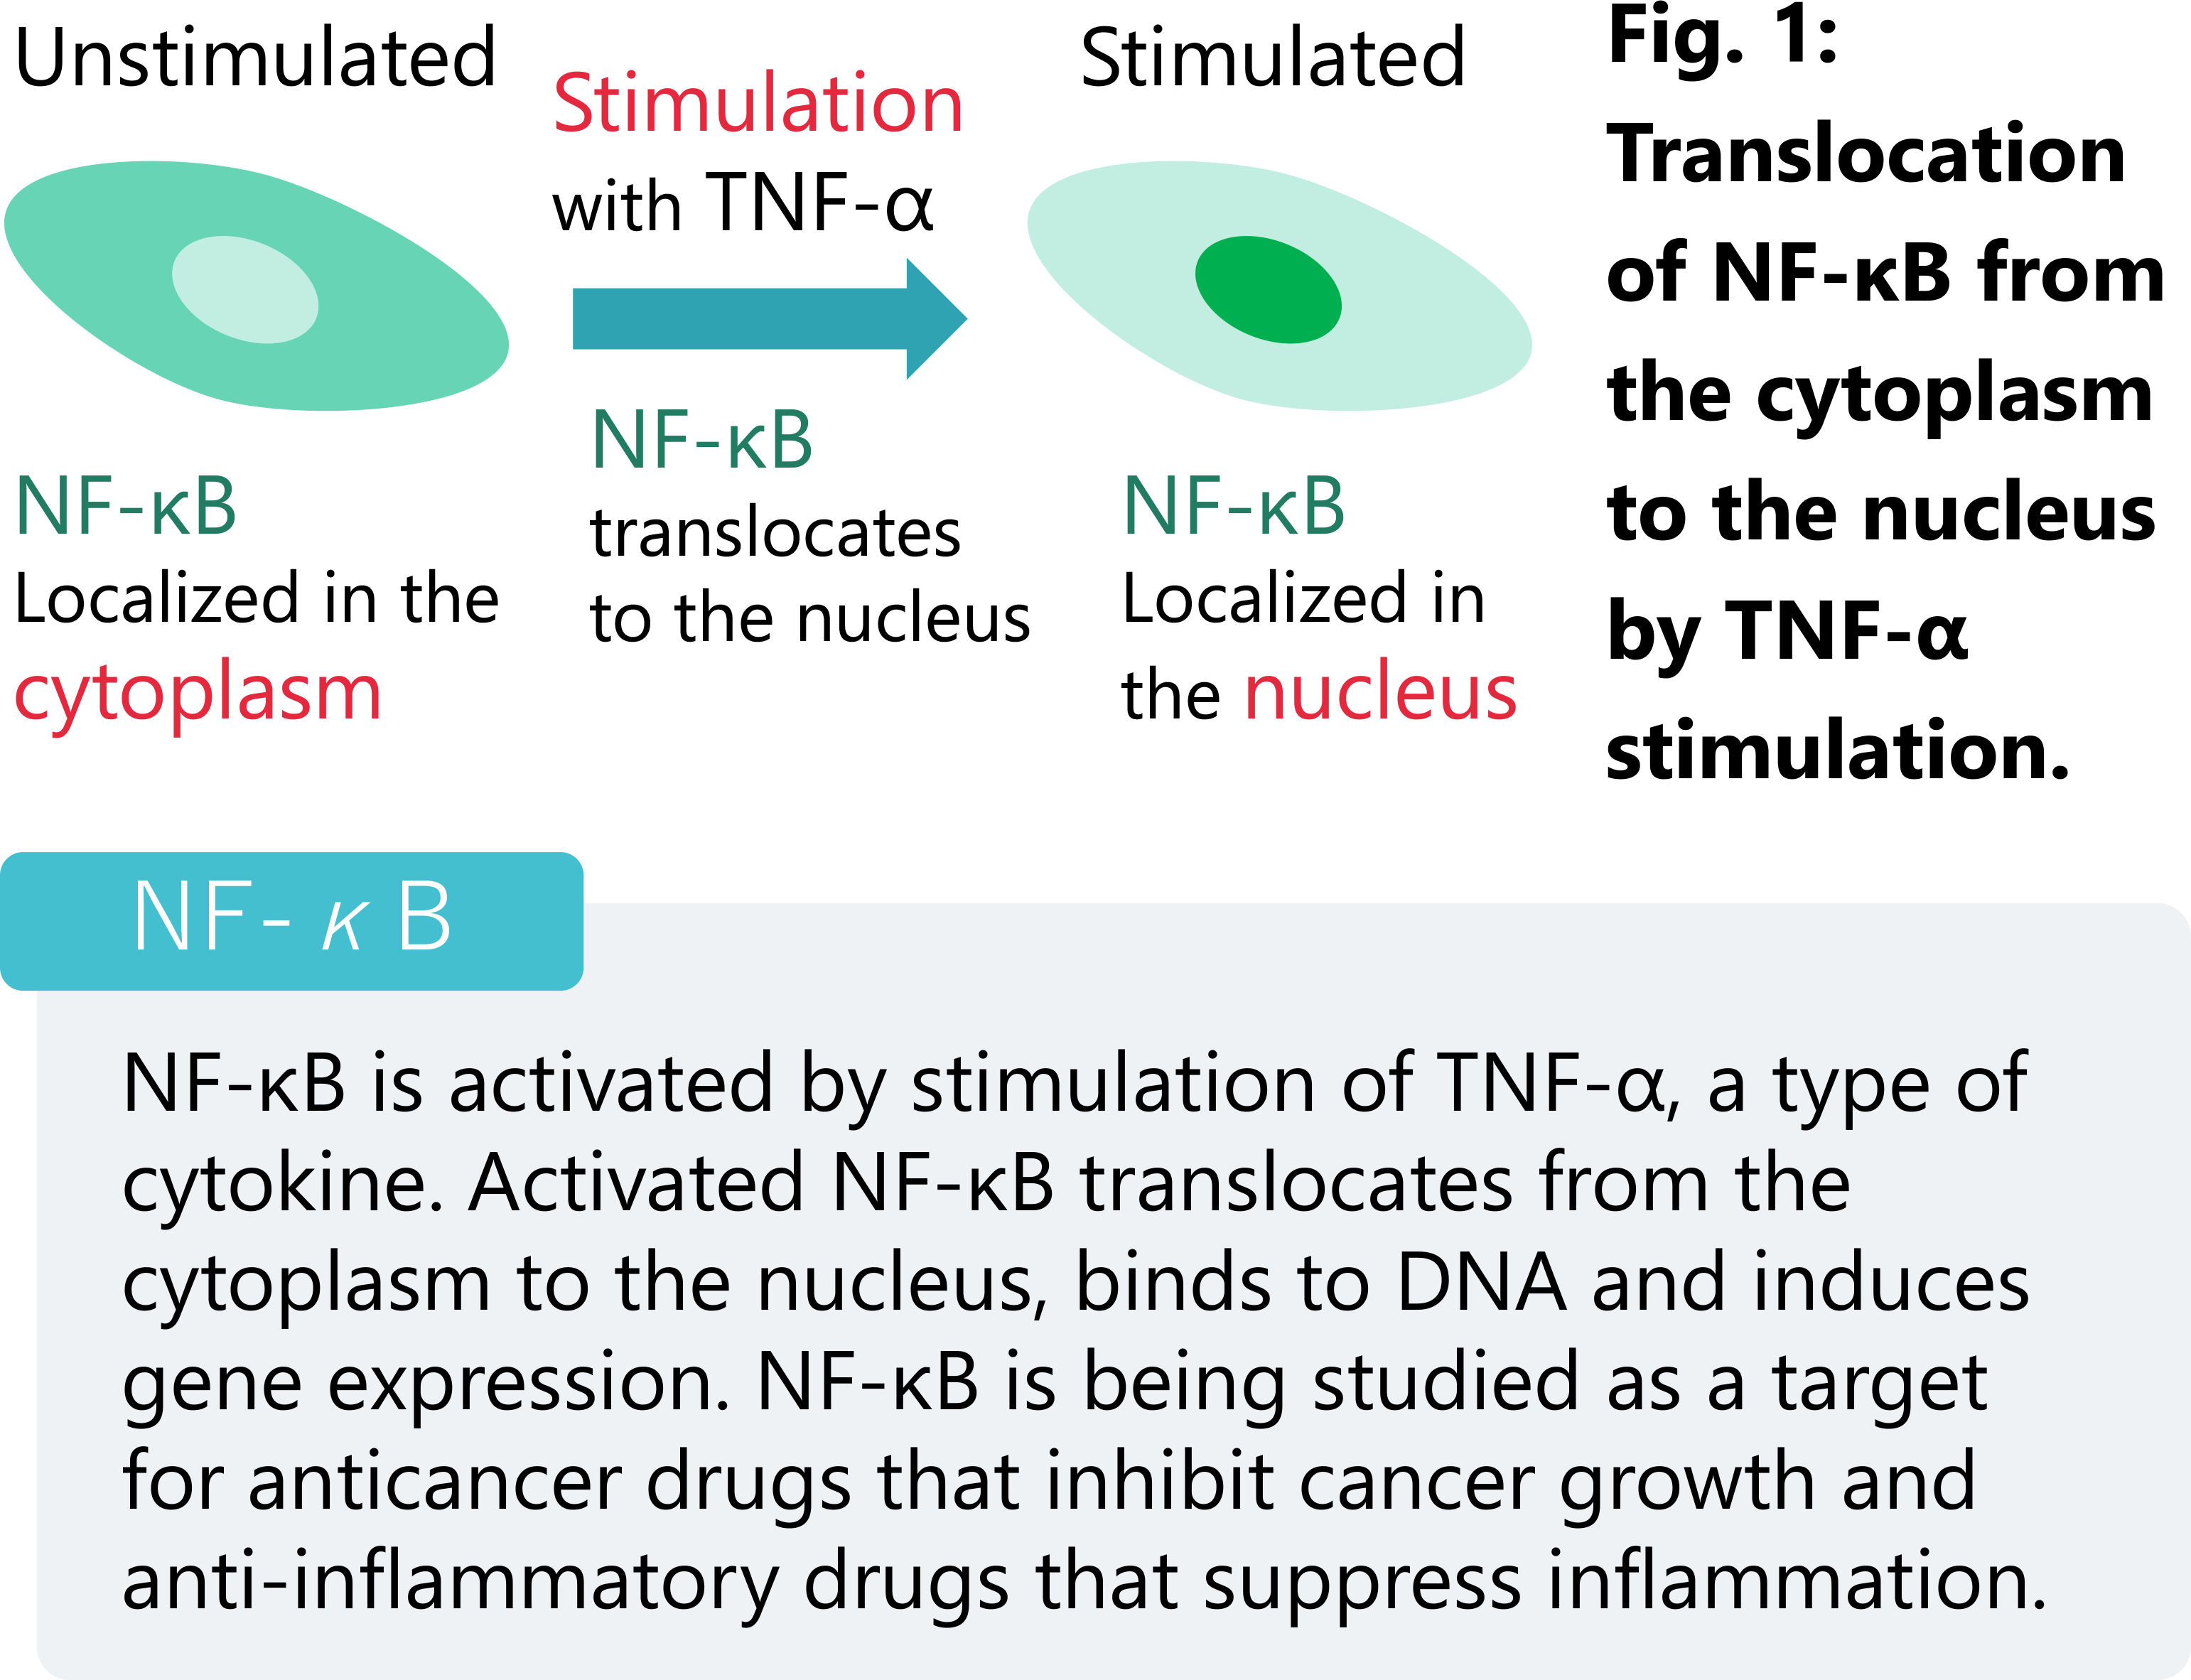
Fig. 2: Definition of mask region and quantification method of nuclear translocation.Upper row: A nuclei mask (yellow) is created from the inside of the nucleus region detected by DAPI.A ring-shaped mask (green) outside the nucleus defines the cytoplasmic region. Nuclear translocation of NF-κB is quantified by measuring the fluorescence (FL) intensity ratio of the inner nucleus (yellow) and the cytoplasm ring (green). Middle row: Control image (NF-κB localized in the cytoplasm), Lower row: Image treated with TNF-α 200 ng/mL for 30 minutes (NF-κB localized in the nucleus). Immunofluorescence staining images of NF-κB (green) in HeLa cells.
Fig. 3: Images and dose-response curves of HeLa cells treated with control and TNF-α for 30 min.
(A, B) Immunofluorescence staining images of NF-κB (green) in HeLa cells, scale bar: 100 μm, (A) control, (B) Image treated with TNF-α 200 ng/mL for 30 minutes, (C) Dose-response curve showing the results of TNF-α dose-dependent increase in nuclear translocation of NF-κB, X-axis: drug concentration (log), Y-axis: fluorescence intensity ratio of nucleus and cytoplasm (average), NucCytoRatio: Nuclei Circle Fluorescence intensity/Cytoplasm Ring Fluorescence intensity, EC50 = 0.950ng/mL、Z’-factor = 0.724, Left image: NF-κB is localized in the cytoplasm. Right image: NF-κB is localized in the nucleus.
| Cell Line | HeLa (RIKEN RCB0007) |
|---|---|
| Growth medium | MEM + 10%FBS + 1%Pc/Sm |
| Culture vessel | EZVIEW ® Culture Plate B (Glass Bottom Plate) Microplate 96 well (AGC techno glass (IWAKI), 5866-096) |
| Substance | TNF-α |
|---|---|
| Test concentration | Negative control: 0 ng/ml |
| Plate map example | 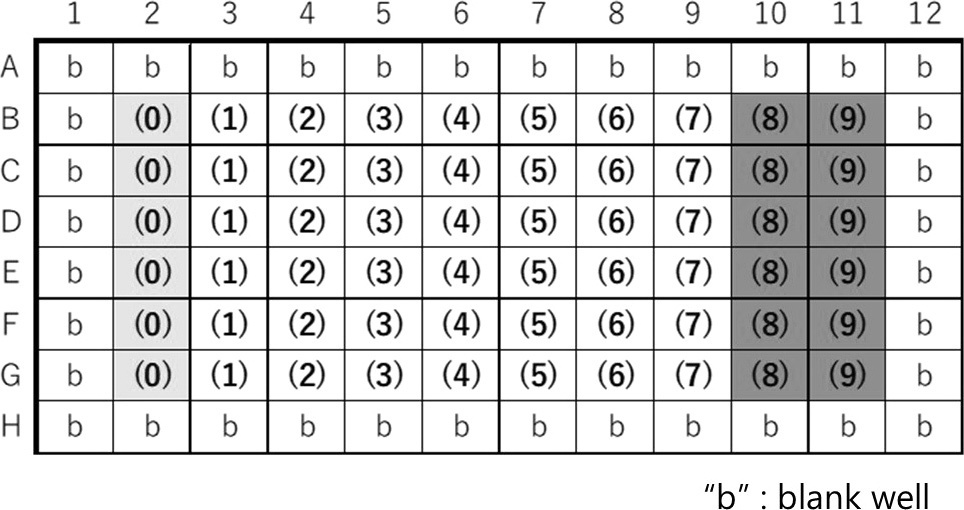 |
| Product name | Item number | Supplier |
|---|---|---|
| Recombinant Human TNF-α | 300-01-A | PeproTech |
| Rabbit anti NF-κB p65 antibody (primary antibody) | ab16502 | Abcam |
| Goat Anti-Rabbit IgG H&L (Alexa Fluor ® 488) (secondary antibody) |
ab150077 | Abcam |
| DAPI Solution | 62248 | Thermo Fisher Scientific |
| MEM (Minimum Essential Medium) | 11095080 | Thermo Fisher Scientific |
| Fetal bovine serum (FBS) | 10437028 | Thermo Fisher Scientific |
| Penicillin-Streptomycin (Pc/Sm) (10,000 U/ml) |
15140122 | Thermo Fisher Scientific |
| 16%-Paraformaldehyde Aqueous Solution (16% PFA) *Dilute by 4% with PBS before use |
11850-14 | Nacalai Tesque |
*Compatible with only glass bottom well plates.
Trask, OJ, Nuclear Factor Kappa B (NF-κB) Translocation Assay Development and Validation for High Content Screening. Assay Guidance Manual (2012)
Smart Imaging System ECLIPSE Ji
ECLIPSE Ji is an AI-Driven, fully automated imaging system. By using it in combination with NIS-Elements SE, image acquisition, analysis, and graph creation can be run seamlessly and automatically. It is equipped with "CellFinder.ai“, which uses AI to find the optimal focal plane in autofocus settings that normally require advanced human judgment. Various trained AIs are implemented in the image acquisition and analysis process. This greatly reduces the number of steps for setting and optimization and makes it easier for everyone to get results.
Imaging Software NIS-Elements SE Nuclear Translocation (Option)


