Live Cell Imaging of Alphaherpes Virus Anterograde Transport and Spread
Abstract
Advances in live cell fluorescence microscopy techniques, as well as the construction of recombinant viral strains that express fluorescent fusion proteins have enabled real-time visualization of transport and spread of alphaherpes virus infection of neurons. The utility of novel fluorescent fusion proteins to viral membrane, tegument, and capsids, in conjunction with live cell imaging, identified viral particle assemblies undergoing transport within axons. Similar tools have been successfully employed for analyses of cell-cell spread of viral particles to quantify the number and diversity of virions transmitted between cells. Importantly, the techniques of live cell imaging of anterograde transport and spread produce a wealth of information including particle transport velocities, distributions of particles, and temporal analyses of protein localization. Alongside classical viral genetic techniques, these methodologies have provided critical insights into important mechanistic questions. In this article we describe in detail the imaging methods that were developed to answer basic questions of alphaherpes virus transport and spread.
Introduction
Infection of the peripheral nervous system (PNS) by alphaherpes viruses such as herpes simplex virus (HSV) -1, -2, and pseudorabies virus (PRV) involves several intricate and highly regulated steps throughout the viral life cycle. Transport within neurons of the PNS is critical during the events of both primary viral infection and subsequent inter-host spread. The molecular mechanisms that modulate two components of the viral life cycle; directed transport of viral assemblies away from cell bodies within axons (anterograde transport) and subsequent transmission of virions to susceptible cells (anterograde spread) are important to understanding herpesvirus pathogenesis.
The transport and egress of viral particles in neurons is dependent on assembly of a mature infectious virion1,2. Previously fixed assays, including immunofluorescence (IF) and electron microscopy (EM), were used to study the particle assembly state and protein interactions associated with virion transport and spread 3-6. However the dynamic nature of transporting virions and experimental artifacts introduced by chemical fixation confounded the interpretation of fixed images 7,8. Recently, a number of viral-fluorescent fusion proteins have been described for HSV and PRV that have negligible impacts on protein function. Green Fluorescent Protein (GFP) and Red fluorescent proteins (mCherry or mRFP) fluorophores are often paired to allow imaging of two of the three structural components of a mature virion: capsid, tegument, and glycoprotein 9-11. Live cell imaging of anterograde transport using dual-labeled viruses visualizes the assembly state of viral particles during transport. Similar fluorophore expressing viral strains are used to visualize number and the diversity of viral genomes following spread 12,13. The properties of the fluorescent proteins (reviewed in 14,15) greatly impact the ability to visualize viral or cellular assemblies. The intrinsic properties of the fluorescent protein, including self-interactions and stability, should be considered when designing and testing novel protein fusions for the preservation of wild-type functionality.
In conjunction with fluorescent protein fusions, two well-characterized in vitro cell culture systems are employed for live cell imaging of herpes virus infection: dissociated 16 and compartmentalized 17 (Figure 1A) rat superior cervical ganglia (SCG) neurons. In both systems, embryonic SCG's are dissected, dissociated to single cell bodies, and plated for in vitro culturing 18. SCG neurons are part of the autonomic nervous system and can be readily cultured and differentiated by neuronal growth factor (NGF) into a mature polarized state ex vivo. Dissociated SCG neurons form an extended network of axons that allows for the visualization of viral particles as they undergo anterograde transport 6. Compartmentalized SCG cultures provide fluidic isolation of the neuronal cell body (S compartment) and distal axon termini (N compartment) 19. A number of detailed protocols for the construction and use of compartmentalized neurons using original 20 or modified Campenot chambers 17 have been published previously. Fluidic isolation allows for selective infection of neuronal cell bodies and detection of progeny virions after transport to isolated axon termini. Plating epithelial cells over the termini prior to infection provides recipient cells for spread of viral infection.
There are many essential elements important for all live cell imaging experimentation, but the most relevant to our protocols are: automated image acquisition, fluorescent illumination, speed of imaging, and environmental control. For all imaging experiments, we use an inverted, automated, epifluorescence illumination microscope (Figure 1B). The microscope is built around the Nikon Eclipse Ti base and employs a number of computer controlled motorized systems to rapidly reconfigure the microscope during automated image acquisition. For fluorescence illumination, we use a broad-spectrum mercury arc lamp that can be attenuated with neutral density filters along the illumination path. Excitation filters limit the spectrum of fluorescent illumination and when paired with multi-pass dichroic mirrors and fluorescence emission filters visualize specific fluorescent compounds. The excitation and emission filters are mounted in independent, fast switching filter wheels to enable rapid sequential acquisition of different fluorescent channels. The speed of image acquisition is further enhanced with a sensitive and fast EM-CCD camera, useful for detection of low intensity signals and short image read times. Environmental control on the microscope is achieved with a stage top heated incubator and an objective lens heater to maintain samples at elevated temperatures while a humidified and CO2 enriched atmosphere is passed into the incubator. The microscope is kept in a darkened room with ambient temperature maintained close to 25 °C and outside light minimized with blackout curtains on all windows. The following protocols describe the use of this system for anterograde transport and spread assays.
A number of alternatives exist to control for the variables of live cell imaging. The control of microscopy settings can be performed manually or through automated systems dependent on proprietary software. Fluorescence illumination can be achieved with halogen, LED or laser sources. The speed of imaging is modified by the speed of filter switching and the time to visualize the signal with the paired detection system. Environmental control can be achieved with specialized hardware on the microscope stage, enclosure of all or part of the microscope in a heated and humidified box, or by elevating the temperature of the room where microscopy will be performed. Each of these alternatives has advantages and disadvantages related to cost and performance.
In the subsequent protocol, we detail the use of live cell imaging to study rapid anterograde transport and anterograde spread of alphaherpes viruses through the use of recombinant viral strains. Real-time live cell imaging visualizes capsid, tegument, and/or glycoprotein co-localization on dynamic structures undergoing transport within axons 11. Overnight timelapse imaging of compartmentalized neuronal cultures visualizes axonal virion egress and infection of susceptible cells 12. The protocols presented here have been optimized for use with our particular imaging system, but are presented in broad terms relative to the four elements of live cell imaging. In the discussion we will further detail some of the optimization that is necessary for successful experimentation.
Protocol
Section 1 - Environmental Control Conditions for Live-cell Fluorescence Microscopy
- 30 min prior to any imaging experiment connect and begin warming the microscope stage top incubator.
- Turn on microscope, transmitted and epifluorescent light sources, and automated hardware controls. Open the microscope control software, NIS Elements, to connect to the microscope and begin cooling the EM-CCD camera.
- Attach Lens warmer to appropriate objective (either 60X or 100X oil immersion). Note: Select objective lens based on experiment type. The 100X differential interference contrast (DIC) is best for tracking of anterograde transporting virion assemblies while the 60X phase objective is suited to visualize anterograde spread. Lower magnification, non-oil immersion objectives do not require a lens warmer as they do not make direct contact with the sample.
- Attach stage top incubator onto the motorized stage of microscope. Ensure the appropriate insert that will hold the sample is in place. Attach the humidified air line from the incubator control to the input port on the stage top incubator.
- Turn on incubator and lens warmer controls and adjust temperature settings to previously verified conditions specific for the objective and sample being imaged (see discussion).
- Open the control valve on the 5% CO2/95% atmospheric tank to provide CO2 supplemented air to stage top incubator. The flow rate should be between 60 and 80 ml of gas per minute. Faster rates will result in extensive sample dehydration despite the humidifying chamber.
- Add lens oil to objective lens and immediately place the culture that will be imaged into the stage top incubator.
- Allow equilibration of temperature in the culture for a minimum of 10 min. One hour is preferred, especially for overnight imaging described in Section 3.
Section 2 - Real-time Imaging of Anterograde Virion Transport Events Protocol
- Six to eight hours prior to imaging, infect a 35 mm coverslip-bottom dish of mature, dissociated SCG neurons with 1 x 10⁶ plaque forming units of the virus of interest (See Table 1 for example viruses) using the method described in Taylor et al. 2012a 11. If testing more than one virus, off-set inoculations by 30-60 min to allow for imaging of sequential samples at similar times post infection.
- Insert dish into stage top incubator for a minimum of 10 min before running any experiment. While the temperature equilibrates, the focal plane is shifting and will negatively impact any imaging experiments.
- Using transmitted light and the eyepiece of the microscope, find a neuronal cell body that has a clearly isolated axonal extension. Alternatively, use the appropriate fluorescence illumination to find a cell expressing detectable amounts of fluorescent proteins. It is important to limit exposure of sample to fluorescent illumination, at this step and subsequent steps, because of light induced cellular damage and bleaching of fluorescent proteins.
- Attenuate fluorescence illumination to reduce the intensity of excitation light to which the cells are exposed. Engage light attenuating Neutral Density (ND) filters in the fluorescence illumination light path. For movies lasting longer than 1 min, a minimum of ND4 must be used to prevent photo-bleaching of fluorescent proteins and extensive photo-damage of axons. Highly fluorescent structures can typically be visualized with an ND8 filter in place.
- Using the microscope software (Figure 2 and Supplemental Movie 1A), switch the light-path to the EM-CCD camera.
- Determine optimum imaging times and conditions for each fluorescent channel.
- Initiate a live image window using the "Play" button.
- Determine the optimal camera exposure settings for each fluorescent protein. Do not exceed 300 msec per channel as motional aberrations of fast moving virion structures will occur. Utilize the EM gain of the camera to a setting of 300 (manufacturer suggested maximum gain), to minimize exposure time and enhance detection of dim signals. Correct exposure times should produce an image with low background intensity and high specific signals.
- After setting exposures and finding a well-defined region of axon, the software must be configured to perform automated image acquisition. Stop the live imaging window to prevent sample bleaching.
- In the NIS Elements software, select the 6D - Define/Run Experiment application from the "Applications" drop down menu.
- In the ND acquisition window, click the Time tab which will determine the frequency of image acquisition. Set the Interval to "No Delay" and the Duration to 5 min. The software will then acquire image frames at the highest frequency possible for duration of 5 min.
- Select the "Lambda" tab, which allows selection of the pre-set hardware configurations used for multiple fluorescent image acquisition. Click the first box and in the subsequent drop down menu to select an appropriate hardware configuration. Repeat for all fluorescent proteins to be imaged.
- Ensure the tabs for "XY Positions", "Z-series" and "Large Image" are de-selected.
- Above the tabs, select the box marked "Save to File" to automatically save images to the hard disk during acquisition. Configure the location and file name of the experiment output file. As sequential experiments are performed, the software will add a sequential number at the end of the designated file name.
- Once all tabs have been selected. Initiate the experiment by clicking the "Run-Now" button.
- Optimize the image acquisition rate through exposure settings and image size. Using a small region of the image-able area will often speed up frame acquisition rates. Define the Region of Interest using the ROI tool in NIS-Elements, selecting an area between 25% and 50% of the total image area. Alternatively, shorter exposure times will increase frame acquisition rates, but decreases the quality of signal (see discussion).
Section 3 - Overnight Time-lapse Imaging of Anterograde Spread Events
- Four hours prior to imaging, infect a compartmentalized neuronal culture constructed on a 35 mm μ-Dish. Inoculate neuronal cell bodies with 1 x 10⁶ plaque forming units of the virus of interest (See Table 1 for example viruses) using the method described in Taylor et al. 2012b 12.
- Gently place culture dish into the stage top incubator. Ensure the position of the objective is set to the side of the dish. Slowly bring the objective into focus, ensuring the objective does not push up into the sample. Once the focus field has been identified, slowly move the objective into the center of the dish, near the internal barrier demarking the internal side of the axon compartment. During movement, ensure the focus depth is maintained and avoid pushing up into the sample. Deflection of the plastic surface by the objective will damage the axons and the plastic.
- Add approximately 2 ml of warm (~37 ° C) phosphate buffered saline to the culture dish outside of the Teflon ring. This surrounds the neuronal culture with a ring of PBS to minimize sample dehydration and provide thermal insulation.
- Allow temperature to equilibrate for a minimum of 1 hr prior to initiating automated image acquisition (3.8). Steps 3.5 through 3.7 can be configured during this time.
- Restrict the intensity of illumination to the lowest possible level by engaging all neutral density filters. This will allow frequent image acquisition over long time periods without excessive photo-damage. Reducing illumination will result in low signal, requiring longer exposures (see discussion).
- Use historical exposure settings or prior to experimental set-up generate a parallel dish of infected epithelial cells expressing the target fluorescent proteins to establish exposure settings as described in Section 2.5.
- After setting exposures for the necessary channels, it is time to configure the software for automated image acquisition. Stop the live imaging window to limit sample bleaching.
- In Elements software (Figure 2 and supplemental movie 2), select the 6D - Define/Run Experiment application from the "Applications" drop down menu to bring up the ND Acquisition window.
- In ND Acquisition window, click the Time tab. Set the Interval to "5 min". Set the Duration to 20 hr. The loops field will be automatically calculated for the number of repetitions the program will perform.
- Select the "Lambda" tab. Click the first box and in the subsequent drop down menu select the appropriate lambda configuration for Phase contrast. Repeat for subsequent positions, selecting the appropriate configurations for each fluorescent protein to be imaged.
- Select the "Large Image" tab, which determines the parameters of multiple images to be combined into a single larger field of view A good-sized area consists of 5 x 2 images using a 7% stitching overlap. This will allow for the maximum number of cells per position to be imaged without impacting the frequency of image acquisition. Also, deselect the checkbox for "Close Active Shutter during Stage movement". This option enhances the speed of acquisition by not closing shutters between images.
- Select the "XY Positions" tab, to identify multiple positions that will be sequentially imaged in parallel during the course of the overnight movie. Select positions that define the center point for each large image area. Select 6-8 image positions in the sample. A good image area will have small clusters of cells in close apposition to clearly defined axons. Cells should not be piled on top of each other and axon bundling should be minimized. The point of focus is the nucleus of the cell. Position the objective such that a clearly defined nuclear envelope is seen for the majority of the cells.
- Ensure the "Z-series" tab is deselected.
- Configure the auto-save feature as described above in Section 2.6.5.
- Test the exposure and position settings by clicking "1 time loop". Evaluate the resulting images for transmitted light illumination, focus, and framing. If focus has shifted, reset the focus for each position under the X-Y tab. Wait 10 min and repeat this step until focus is stable.
- After all settings have been verified and tested, initiate the automated experiment by clicking the "Run Now" button.
Section 4 - Image Processing and Export
Data Export
- Datasets obtained during live-cell imaging of transport or spread events should be exported from the NIS Elements software into commonly used file types for later use in presentations and publications (Supplemental Movie 3). To export movies open the appropriate raw .nd2 file in NIS Elements and select the "split-component" view to visualize the desired fluorescent channels. Playback the file at a suitable speed; 5 frames per second is a good starting point for visualization of fast-transport.
- Include a timestamp to represent a real-time clock during movie playback. Right-click on the image and select, Add ND-information. A digital counter will appear in the upper left corner.
- Edit the time-stamp to display information. Right click on the counter and select Edit ND-information. In the subsequent pop-up window, edit the text to reflect the imaging parameters that are important. Edit font, color and size for clarity.
- Go to the "Edit" menu and find "Create view snapshot" or press the "x" key. This command opens the "view snapshot" window. Select "apply to all frames" to generate an 8-bit, RGB, export-ready file containing the fluorescent channels from the entire movie.
- Save as an .avi file for cross-platform compatibility. Set playback rate at 200 msec per frame. The .avi files generated by NIS Elements can then be further compressed with other conversion software into the desired file type.
Representative Results
Application of this protocol to infections of dissociated SCG cultures with PRV 348, a recombinant PRV strain expressing GFP-Us9 and gM-mCherry membrane fusion proteins, has facilitated the visualization of the anterograde transport of virions (Figure 3 and Supplemental Movie 4). Incorporation of these fusion proteins into viral particles results in their detection on transporting puncta, and the aforementioned imaging conditions minimize the offset of each fluorophore on a moving particle during filter switching. In a three-minute imaging window, numerous transporting puncta are commonly observed and large sample sizes for colocalization analyses are rapidly generated. We have previously quantified the colocalization of GFP-Us9, the alphaherpes virus axonal targeting protein, with other structural proteins using this approach 11. Similar analyses of other dual recombinant PRV strains have also been described 11, and recent work has documented the co-transport of PRV proteins with a fluorescently tagged host motor protein in a further extension of this protocol 21. Utilizing fast switching filter wheels and paired multi-pass dichroic mirrors allows rapid sequential acquisition of two or more fluorescent channels. We can currently achieve two-channel sequential acquisition at speeds of up to 0.8 frames per second. For single channel video microscopy, which is limited only by the fluorescence exposure time and read-time of the camera, we can achieve acquisition rates greater than 6 frames per second.
Anterograde Spread
To visualize anterograde spread events, areas of interest are visualized every 5 to 10 min for a 20 hr period, during which time virions will transport down and egress from axons, infecting the nearby epithelial cells. A representative frame from the large image area is presented in Figure 4A and Supplemental Movie 5. Note the spatially separated nature of the fluorescent protein expressing cells, indicative of primary infection from axons. Infected cells can be tracked backwards during the movie to visualize the fluorescent capsids that initiated the viral infection. These individual cells can be isolated from the large frame and tracked without a significant loss of detail. The representative frame (Figure 4B) from Supplemental Movie 6 depicts a time after virions have deposited the fluorescent capsid into the cytoplasm.
Data Analysis
A range of different analyses can be performed on live-cell imaging datasets including particle tracking, colocalization studies, and quantification of virion spread events. We often perform our analyses directly in the NIS Elements software or utilizing a plug-in extension available for the ImageJ software package that enables .nd2 file type support. Different hypotheses and experimental setups necessitate unique analytical methods. Our group has described methods for assessing colocalization of fluorescent proteins on dynamic structures 11,21 and time-lapse quantification of individual particle spread events 10,12,22. The methodologies describe in this manuscript and our previous studies are flexible and can be applied to different viral infections as well as the transport of cellular structures, e.g. mitochondria 23.
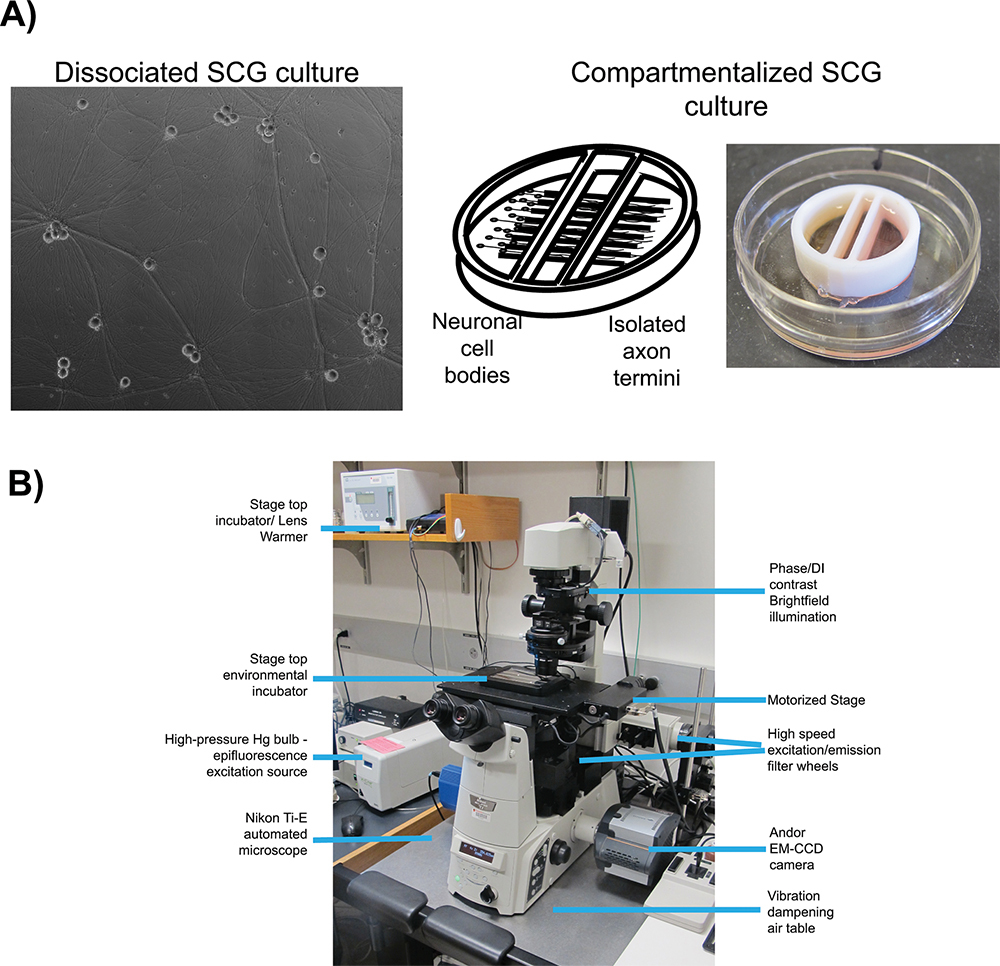
Figure 1. Schematic of microscopy set up for live cell imaging. A) Culture types employed for studies of anterograde transport (dissociated) and anterograde spread (chambered) respectively. Panel 1 is a phase contrast image of a mature, dissociated Superior Cervical Ganglia (SCG). Panel 2 is a schematic of the compartmentalized culture system, pictured in panel 3, with SCG neurons plated in the left compartment with axonal projections extending beneath the internal barriers into the far right compartment. B) The inverted epifluorescent microscope and stage top incubator configuration used for video microscopy experiments.
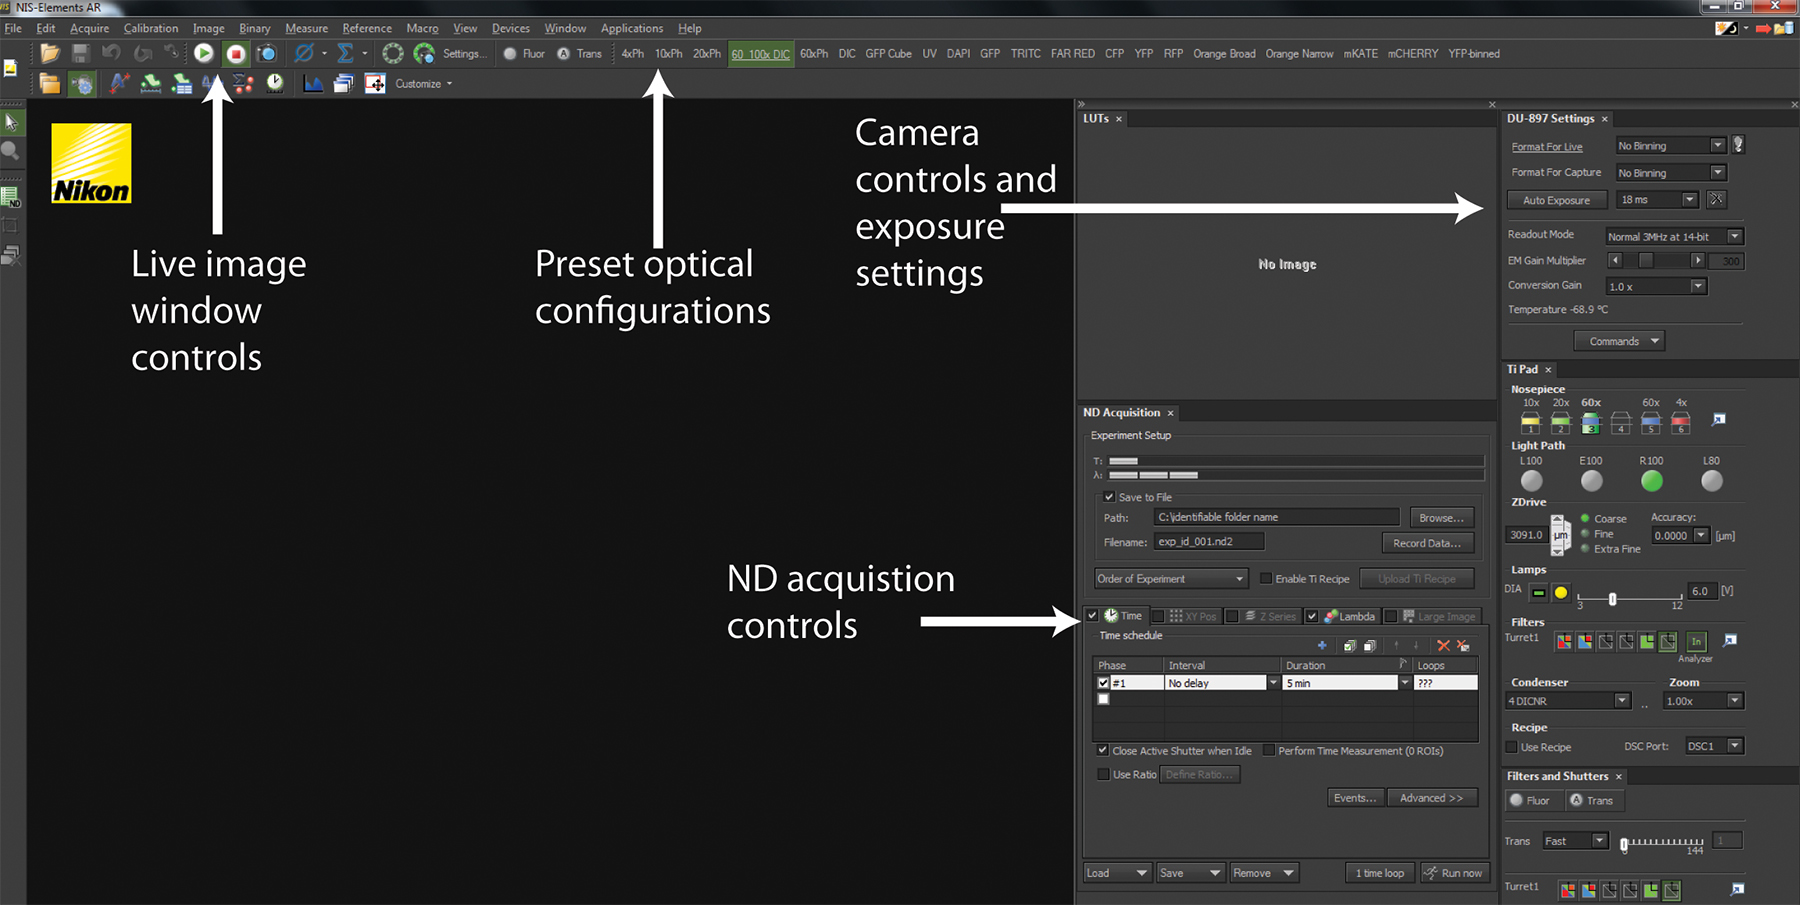
Figure 2. NIS-Elements software interface. A screenshot of a standard user interface in NIS-Elements is displayed. The Play and Stop buttons control the live-image window depicting the current hardware configurations for imaging as well as what is currently being imaged. Across the top panel are a series of Optical Configurations that implement preset hardware settings to configure the microscope for trans-illuminated or fluorescence detection. The Camera control and exposure settings allow configuration of camera detection to optimize image quality and speed. All experiments are coordinated using ND Acquisition controls.
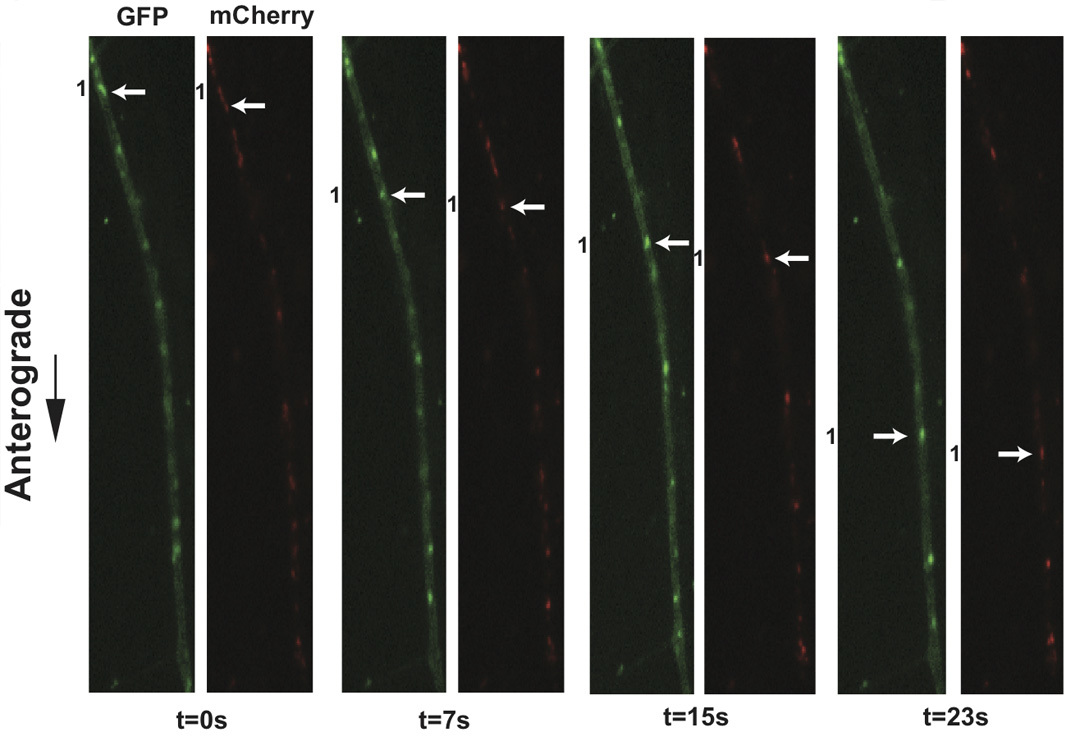
Figure 3. Live cell imaging of SCG axons at 8 hr post-infection with PRV 348. PRV 348 infected neurons express the GFP-Us9 and gM-mCherry membrane fusion proteins. Anterograde-transporting structures within distal axons are visualized in two fluorescent channels, GFP and mCherry. An anterograde-transporting structure (white arrow) progresses within the axon as depicted in the sequential images taken from Supplemental Movie 4. The two fluorescent proteins are spatially off-set due to sequential acquisition of fluorescent channels and the rapid movement of viral structures.
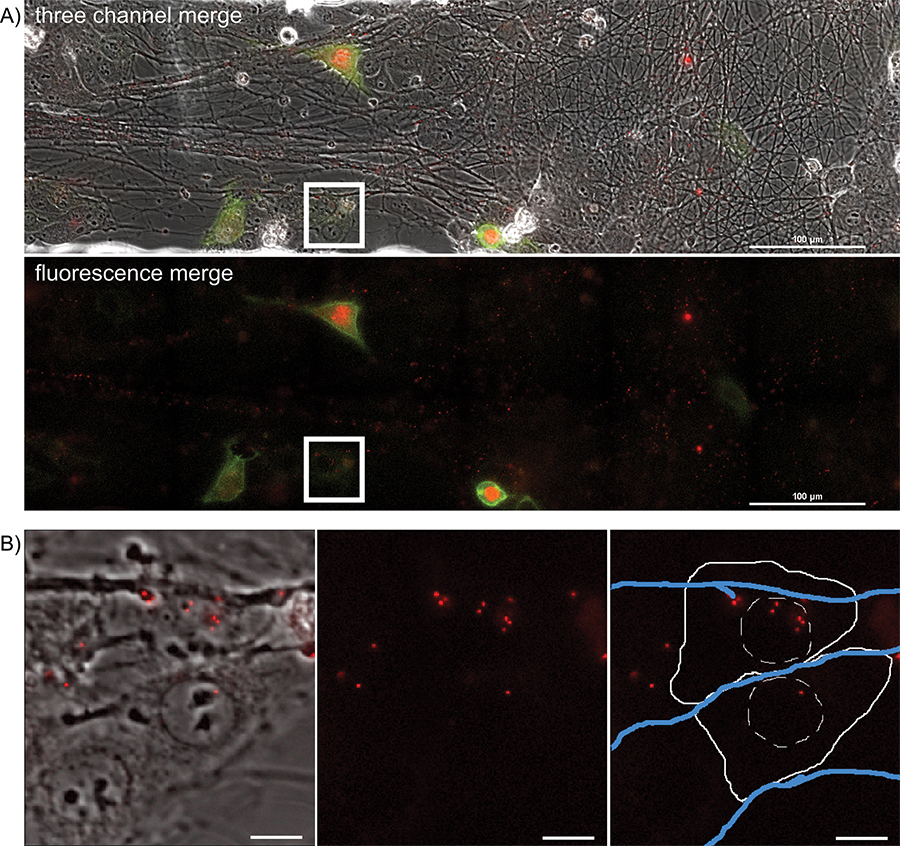
Figure 4. Overnight timelapse imaging of anterograde spread events from infected axons to epithelial cell clusters during a multi-color infection. Representative images from a single position, large image tiled time-lapse movie of virion transmission from PRV 427 infected axons into recipient epithelial cells. A) A merged image of the transmitted, YFP and RFP fluorescent images at a time post infection where recipient cells are beginning to express the YFP-CAAX and VP26-mRFP fusion proteins. In the second panel, the YFP and RFP channels are shown together. Note the large number of mRFP puncta associated with the axon tracts. These are assembled virions undergoing long distance transport within axons (Supplemental Movie 2). The white box represents the area of interest highlighted in part B. B) Representative image of recipient epithelial cells containing infecting capsid assemblies (See also Supplemental Movie 3). Panel 1 is a merge of the transmitted and RFP channels. Panel 2 is the RFP channel alone. Panel 3 is the RFP channel with a schematic representation of the cell outline (solid white line), nucleus (hashed white line), and axons (blue lines).
Supplemental Movie 1. Software settings for rapid, sequential acquisition of axonal virions. The steps associated with determining exposure settings, configuring ND acquisition controls, and acquiring a rapid frame acquisition movie of fluorescent virions undergoing axonal transport is presented. The SCG neuron culture was infected with PRV 427 eight hours prior to imaging. Click here to view movie.
Supplemental Movie 2. Software settings for overnight imaging of axon-to-cell spread. The steps associated with configuring ND acquisition controls for overnight imaging of axon-to-cell spread events are presented. Click here to view movie.
Supplemental Movie 3. Conversion of .nd2 files into presentable movie formats. The steps associated with converting the raw data .nd2 files into either .avi or .mov file formats for presentation using common video players. Click here to view movie.
Supplemental Movie 4. Live cell imaging of SCG axons at 8 hr post-infection with PRV 348. Click here to view movie.
Supplemental Movie 5. Large image area of overnight imaging of axon-to-cell spread. Click here to view movie.
Supplemental Movie 6. Enlarged area of overnight timelapse imaging of axon-to-cell spread. Click here to view movie.
| Strain | Genotype | Utility |
| PRV 341 | GFP-Us9 (membrane) / mRFP-Vp26 (capsid) | Virion transport experiments11 |
| PRV 348 | GFP-Us9 (membrane) / gM-mCherry (membrane) | Virion transport experiments11 |
| PRV 427 | mRFP-VP26 (capsid)/ YFP-CAAX (cellular plasma membrane) | Anterograde spread experiments10 |
Table 1. Useful recombinant PRV strains expressing fluorescent fusion proteins.
| Name | Company | Catalogue number |
| 35 mm glass bottom culture dish | MatTek Corporation; Ashland, MA | P35G-1.5-20-C |
| 35 mm μ-Dish | Ibidi USA LLC, Verona, WI | 81156 |
| Microscope body | Nikon Instruments Inc. | Nikon Eclipse Ti |
| Motorized microscope X-Y stage | Prior Scientific; Rockland, MA | H117 ProScan Flat Top |
| Motorized filter wheels | Prior Scientific | HF110 10 position filter wheel |
| Fluorescent illumination source | Lumen Dynamics; Mississauga, Ontario Canada | X-Cite 120Q |
| Multi-band Fluorescence filter sets | Chroma Technology Corp.; Bellows Falls, VT | 89000 Sedat Quad - ET 89006 ECFP/EYFP/mCherry - ET |
| EM-CCD camera | Andor Technology USA; South Windsor, CT | iXon3 897 |
| Chamlide stage top environmental incubator | Live Cell Instruments; Seoul, South Korea | TC-L-10 |
| Objective lens heater | Bioptecs; Butler, PA | 150803 Controller 150819-12-08 Heater |
| Analysis software | Nikon Instruments Inc.; Melville, NY | NIS Elements |
Discussion
The goal of live cell imaging is observing biological processes as they occur without significant alteration by the act of observation. This goal is achieved by optimizing three variables: environmental control, speed of imaging, and fluorescence illumination. These inter-dependent variables must be balanced to achieve viable imaging conditions. The protocols presented utilize specific conditions to produce the representative results. We will briefly discuss environmental controls and observational damage before detailing the specific methods presented.
Establishing and maintaining relevant biological conditions on the microscope is critical to the successful monitoring of cellular events. Achieving target conditions is dependent on a number of variables specific to the microscope and incubator configuration. All incubator settings should be validated using an independent temperature measurement of a mock sample in the incubator taken at multiple positions including; the point of objective contact, the middle of the culture dish, and the edge of the culture dish. Settings should be optimized to minimize areas that are more than 1 °C warmer than 37 °C as well as maintaining a temperature close to 37 °C at the point of objective contact. Each culture dish and objective configuration used for imaging must be tested and validated prior to experimentation. Ideally, all samples would be monitored for temperature during imaging, but this proves impractical for a number of systems and is complicated when biologically hazardous agents are employed. Validation of incubation conditions is important, as incubating samples at too low or too high of a temperature can result in artifactual results or rapid cellular degradation.
Identifying and minimizing results arising from observational damage is important for protocol development. Frequent illumination can alter biological processes, irreversibly inactivate fluorescent molecules, or induce a number of cellular death pathways. Validating temperature is important to reproduce biologically similar conditions on the stage top analogous to those of a standard tissue culture incubator. Controlling for the effects of frequent illumination is more difficult and often requires iterative trial and error practices. Comparing parallel samples kept in tissue culture incubators for morphological differences or biologically relevant alterations can determine if live-cell imaging conditions results in significant cellular toxicity. In the experiments described here, we have monitored the productivity of viral infection through viral titer as well as extent of viral spread between cells.
Achieving real-time imaging of fast transport within axons requires the optimization of image acquisition speed alongside the intensity of fluorescence illumination. The speed of image acquisition is determined by the camera settings and the microscope hardware, especially when collecting multiple fluorescent channels sequentially. Illumination intensity affects the quality of fluorescent signals and the rate of acquisition. Greater illumination intensity allows easier visualization of fluorescent proteins, particularly for those that incorporate into particles in small quantities. However, the sample will bleach faster and suffer from enhanced phototoxic damage. Reducing illumination through neutral density filters requires longer exposure times, reducing the frequency of image acquisition and potentially causing spatial deformation of fluorescent structures due to their movement during detection. Finding the correct balance of illumination intensity with image acquisition frequency depends greatly on the fluorescent protein signal and the rate of motility of the structure being studied. It is only necessary to acquire enough signal to distinguish the fluorescent structures above background, rather than produce high contrast images that require longer exposure times.
Overnight timelapse imaging utilizes a similar hardware configuration as real-time live-cell imaging but is significantly impacted by accumulated photo-damage associated with long term, frequent fluorescence illumination. Unlike real-time imaging, the need to limit fluorescence illumination intensity is paramount, and all other variables are modified to account for this restriction. Limiting the intensity of exposure allows for more frequent illumination of multiple fluorescent channels without significantly damaging the imaged cells. Anterograde axon-to-cell spread events are temporally and spatially disparate, so imaging a large area is essential to capture as many of these infrequent events as possible.
A number of publications have provided thorough overviews and recommendations for live cell imaging practices24-26. The protocols detailed here represent our best attempts to minimize the impact of fluorescence imaging on viral replication, transport, and spread while preserving the essential features of viral infection. Combining these protocols with the careful development of fluorescent fusion proteins and robust neuronal cultures has answered my fundamental questions of herpesvirus infection and pathogenesis.
Disclosures
We have nothing to disclose.
Acknowledgements
L.W.E. and R.K. are supported by the US National Institutes of Health grants R37 NS033506-16 and R01 NS060699-03. M.P.T. was supported by an American Cancer Society Postdoctoral Research Fellowship (PF-10-057-01-MPC). The advice and knowledge of Dr. Matthew Lyman and Dr. Oren Kobiler were instrumental in designing the microscope configuration and live cell imaging methods. We also extend thanks to Neal Barlow and Brian T. Kain of Nikon Instruments for their technical assistance in the acquisition, installation and performance of the microscope.
Materials
| Name | Company | Catalog Number | Comments |
| 35 mm glass bottom culture dish | MatTek Corporation; Ashland, MA | P35G-1.5-20-C | |
| 35 mm μ-Dish | Ibidi USA LLC, Verona, WI | 81156 | |
| Microscope body | Nikon Instruments Inc. | Nikon Eclipse Ti | |
| Motorized microscope X-Y stage | Prior Scientific; Rockland, MA | H117 ProScan Flat Top | |
| Motorized filter wheels | Prior Scientific | HF110 10 position filter wheel | |
| Fluorescent illumination source | Lumen Dynamics; Mississauga, Ontario Canada | X-Cite 120Q | |
| Multi-band Fluorescence filter sets | Chroma Technology Corp.; Bellows Falls, VT | 89000 Sedat Quad - ET 89006 ECFP/EYFP/mCherry - ET | |
| EM-CCD camera | Andor Technology USA; South Windsor, CT | iXon3 897 | |
| Chamlide stage top environmental incubator | Live Cell Instruments; Seoul, South Korea | TC-L-10 | |
| Objective lens heater | Bioptecs; Butler, PA | 150803 Controller 150819-12-08 Heater | |
| Analysis software | Nikon Instruments Inc.; Melville, NY | NIS Elements |
References
- Johnson, D. C., Baines, J. D. Herpesviruses remodel host membranes for virus egress. Nature reviews. Microbiology. 9, (5), 382-394 (2011).
- Mettenleiter, T. C., Klupp, B. G., Granzow, H. Herpesvirus assembly: a tale of two membranes. Current Opinion in Microbiology. 9, (4), 423-429 (2006).
- Saksena, M. M., Wakisaka, H., et al. Herpes simplex virus type 1 accumulation, envelopment, and exit in growth cones and varicosities in mid-distal regions of axons. Journal of Virology. 80, (7), 3592-3606 (2006).
- Snyder, A., Wisner, T. W., Johnson, D. C. Herpes Simplex Virus Capsids Are Transported in Neuronal Axons without an Envelope Containing the Viral Glycoproteins. Journal of Virology. 80, (22), 11165-11177 (2006).
- Snyder, A., Polcicova, K., Johnson, D. C. Herpes simplex virus gE/gI and US9 proteins promote transport of both capsids and virion glycoproteins in neuronal axons. Journal of Virology. 82, (21), 10613-10624 (2008).
- Tomishima, M. J. A conserved alpha-herpesvirus protein necessary for axonal localization of viral membrane proteins. The Journal of Cell Biology. 154, (4), 741-752 (2001).
- Schnell, U., Dijk, F., Sjollema, K. A., Giepmans, B. N. G. Immunolabeling artifacts and the need for live-cell imaging. Nature Methods. 9, (2), 152-158 (2012).
- Kratchmarov, R., Taylor, M. P., Enquist, L. W. Making the case: Married versus Separate models of alphaherpes virus anterograde transport in axons. Reviews in Medical Virology. 22, (6), 378-391 (2012).
- Antinone, S. E., Smith, G. A. Two modes of herpesvirus trafficking in neurons: membrane acquisition directs motion. Journal of Virology. 80, (22), 11235-11240 (2006).
- Del Rio, T., Ch'ng, T. H., Flood, E. A., Gross, S. P., Enquist, L. W. Heterogeneity of a fluorescent tegument component in single pseudorabies virus virions and enveloped axonal assemblies. Journal of Virology. 79, (7), 3903-3919 (2005).
- Taylor, M. P., Kramer, T., Lyman, M. G., Kratchmarov, R., Enquist, L. W. Visualization of an alphaherpesvirus membrane protein that is essential for anterograde axonal spread of infection in neurons.mBio. 3, (2), (2012).
- Taylor, M. P., Kobiler, O. Alphaherpesvirus axon-to-cell spread involves limited virion transmission.Proceedings of the National Academy of Sciences. (2012).
- Kobiler, O., Brodersen, P., Taylor, M. P., Ludmir, E. B., Enquist, L. W. Herpesvirus replication compartments originate with single incoming viral genomes. mBio. 2, (6), (2011).
- Shaner, N. C., Steinbach, P. A., Tsien, R. Y. A guide to choosing fluorescent proteins. Nature Methods. 2, (12), 905-909 (2005).
- Snapp, E. L. Fluorescent proteins: a cell biologist's user guide. Trends in Cell Biology. 19, (11), 649-655 (2009).
- Ch'ng, T. H., Flood, E. A., Enquist, L. W. Culturing primary and transformed neuronal cells for studying pseudorabies virus infection. Methods in molecular biology (Clifton, N.J.). 292-299 (2005).
- Curanovic, D., Ch'ng, T. H., Szpara, M., Enquist, L. Compartmented neuron cultures for directional infection by alpha herpesviruses. Current protocols in cell biology. Chapter 26, (Unit 26.4), (2009).
- Zareen, N., Greene, L. A. Protocol for culturing sympathetic neurons from rat superior cervical ganglia (SCG). J. Vis. Exp. (23), e988 (2009).
- Ch'ng, T. H., Enquist, L. W. Neuron-to-Cell Spread of Pseudorabies Virus in a Compartmented Neuronal Culture System. Journal of Virology. 79, (17), 10875-10889 (2005).
- Campenot, R. B., Lund, K., Mok, S. -A. Production of compartmented cultures of rat sympathetic neurons.Nature Protocols. 4, (12), 1869-1887 (2009).
- Kramer, T., Greco, T. M., Taylor, M. P., Ambrosini, A. E., Cristea, I. M., Enquist, L. W. Kinesin-3 Mediates Axonal Sorting and Directional Transport of Alphaherpesvirus Particles in Neurons. Cell Host & Microbe. 12, (6), 806-814 (2012).
- Smith, G. A., Gross, S. P., Enquist, L. W. Herpesviruses use bidirectional fast-axonal transport to spread in sensory neurons. Proceedings of the National Academy of Sciences of the United States of America. 98, (6), 3466 (2001).
- Kramer, T., Enquist, L. W. Alphaherpesvirus Infection Disrupts Mitochondrial Transport in Neurons. Cell Host & Microbe. 11, (5), 504-514 (2012).
- Swedlow, J. R., Platani, M. Live cell imaging using wide-field microscopy and deconvolution. Cell Structure and Function. 27, (5), 335-341 (2002).
- Kaech, S., Huang, C. F., Banker, G. Short-Term High-Resolution Imaging of Developing Hippocampal Neurons in Culture. Cold Spring Harbor Protocols. 2012, (3), (2012).
- Frigault, M. M., Lacoste, J., Swift, J. L., Brown, C. M. Live-cell microscopy - tips and tools. Journal of Cell Science. 122, (6), 753-767 (2009).