An Ex Vivo Laser-induced Spinal Cord Injury Model to Assess Mechanisms of Axonal Degeneration in Real-time
Abstract
Injured CNS axons fail to regenerate and often retract away from the injury site. Axons spared from the initial injury may later undergo secondary axonal degeneration. Lack of growth cone formation, regeneration, and loss of additional myelinated axonal projections within the spinal cord greatly limits neurological recovery following injury. To assess how central myelinated axons of the spinal cord respond to injury, we developed an ex vivoliving spinal cord model utilizing transgenic mice that express yellow fluorescent protein in axons and a focal and highly reproducible laser-induced spinal cord injury to document the fate of axons and myelin (lipophilic fluorescent dye Nile Red) over time using two-photon excitation time-lapse microscopy. Dynamic processes such as acute axonal injury, axonal retraction, and myelin degeneration are best studied in real-time. However, the non-focal nature of contusion-based injuries and movement artifacts encountered during in vivo spinal cord imaging make differentiating primary and secondary axonal injury responses using high resolution microscopy challenging. The ex vivo spinal cord model described here mimics several aspects of clinically relevant contusion/compression-induced axonal pathologies including axonal swelling, spheroid formation, axonal transection, and peri-axonal swelling providing a useful model to study these dynamic processes in real-time. Major advantages of this model are excellent spatiotemporal resolution that allows differentiation between the primary insult that directly injures axons and secondary injury mechanisms; controlled infusion of reagents directly to the perfusate bathing the cord; precise alterations of the environmental milieu (e.g., calcium, sodium ions, known contributors to axonal injury, but near impossible to manipulate in vivo); and murine models also offer an advantage as they provide an opportunity to visualize and manipulate genetically identified cell populations and subcellular structures. Here, we describe how to isolate and image the living spinal cord from mice to capture dynamics of acute axonal injury.
Introduction
Degeneration of axons is a prominent cause of morbidity spanning several neurological conditions including neurotrauma, stroke, autoimmune, and neurodegenerative diseases. Unlike the peripheral nervous system (PNS), central nervous system (CNS) axons have a limited capacity to regenerate once injured due to both intrinsic and extrinsic barriers (i.e., inhibitory molecules to axonal growth produced during scar formation and liberated during myelin degeneration)1-7. Although several of these barriers have been extensively explored, therapeutic interventions aimed to prevent CNS axonal degeneration, promote robust axonal regeneration, and restore functional connectively, remain limited.
Axons once separated from their soma undergo a stereotypical process of degeneration known as Wallerian degeneration that is characterized by axonal swelling, spheroid formation and eventual fragmentation (reviewed in 8). In contrast, the proximal stump that remains in continuity with the soma of a transected peripheral axon, forms a swelling at its end, dies back to the nearest node of Ranvier, and can then initiate growth cone formation, a vital prerequisite necessary for subsequent axonal regeneration9-11. In contrast, the proximal axonal endings of many central axons form characteristic “endbulbs” or retraction bulbs, fail to form growth cones, and instead retract away from the injury site where they remain for months after injury12-15. In addition to the primary axonal injury, additional axonal damage/loss may also occur to axons that were largely spared from the initial injury. This delayed axonal loss of initially spared axons is referred to as secondary axonal degeneration. This inherent response of CNS axons to injury renders functional axonal regeneration an even more difficult goal to achieve in the brain and spinal cord.
Although hallmarks of axonal injury (e.g., spheroid formation, retraction bulbs) have been well characterized from post-mortem tissue and experimental models of axonal degeneration, elucidation of the molecular mechanisms underlying these dynamic processes has been restricted. Most of these studies relied on static endpoint observations that inherently failed to capture individual axonal responses over time. Though exogenously applied axonal tracers have been useful to elucidate axonal responses from static sections and during live imaging, the availability of genetically encoded axonal markers has greatly improved our ability to visualize axons in real-time using fluorescence microscopy. Indeed, a seminal report from Kerschensteiner and colleagues first provided direct evidence of axonal degeneration and regeneration in vivo using Thy1-GFP-S mice that encode green fluorescent protein in subsets of neurons that send their projections in the dorsal columns of the spinal cord16. Live imaging approaches using two photon laser scanning microscopy (TPLSM) and genetic fluorescent protein labeling of cells of interest continues to provide direct evidence and mechanistic insight into many diverse dynamic processes such as axonal degeneration, Ca2+ signaling, axonal regeneration, astrocyte physiology, microglial physiology, and response to injury17-25.
In contrast to axons, very little is known of myelin responses to injury in real-time. Myelin is a vital component of white matter produced and maintained by oligodendrocytes in the CNS and Schwann cells in the PNS. Myelin insulates 99% of the surface of axons and by doing so provides a high-resistance, low-capacitance protective covering that supports rapid and efficient saltatory impulse propagation, recently reviewed by Buttermore et al.26. To capture the dynamic response of myelin to injury we use the solvatochromic, lipophilic fluorescent dye Nile Red27. The solvatochromic properties of this vital stain allow spectral shifts of its emission spectrum that is dependent on the physico-chemical environment28,29. These properties are useful to gain insight into mechanisms of axomyelinic injury and can be visualized using appropriately selected dichroics and emission filters or resolved using spectral microscopy27. For example, Nile Red’s emission spectrum is blue-shifted in less polar, lipid-rich environments such as those found in adipocytes and normal CNS myelin (peak emission ~ 580-590 nm)27. In contrast, this vital dye’s emission spectrum peaks at ~ 625 nm in endbulbs formed as axons undergo axonal dieback27. Although the precise mechanisms underlying these spectral shifts specifically in endbulbs versus normal myelin remain unclear, such spectral changes may reveal underlying alterations in protein accumulation or disorganization leading to exposure of hydrophobic binding sites 27.
While in vivo imaging is the ultimate metric for observing spinal cord axonal injury dynamics in their native environment, it is technically challenging and requires substantial surgical expertise, and often repeat surgeries to expose the dorsal column that may introduce experimental artifacts (e.g., inflammation and scar formation). In addition, costly equipment is often needed to allow suspension and positioning of an intact animal under the microscope objective lens. The animals need to be carefully monitored as well to ensure they remain warm, to ensure fluids are replenished, and to ensure there are no signs of hypoxia due to prolonged anesthetized imaging sessions. The latter is extremely important as axons and myelin absolutely require constant perfusion and adequate oxygen levels to remain viable. However, this is often not reported or monitored in most in vivostudies to date. In addition, movement artifacts due to heart rate and breathing (isoflurane anesthetized adult mouse: ~ 300-450 beats per min (BPM) is optimal to maintain 97-98% oxygen saturation (normal rate ~ 632 BPM) and ~ 55-65 breaths per min (normal rate is ~ 163 breaths per min), respectively))30 encountered during in vivo spinal cord imaging make differentiating primary and secondary axonal injury responses using high resolution fluorescence microscopy challenging as even the fastest laser scans unavoidably are subject to these movement artifacts. Advances in ultrafast resonant scanners combined with an implantable rigid vertebral framed window may allow imaging of the murine spinal cord in awake animals, but faster scan times inevitably reduce the signal to noise ratio degrading image quality. Further improvements in spinal cord imaging techniques as currently used for brain imaging may overcome many of these obstacles and limit potential confounds introduced by inadequate tissue perfusion, e.g., 31-33.
Much of what is known about white matter physiology and mechanisms of white matter injury has been determined using in vitro or ex vivo preparations of white matter from optic nerve, peripheral nerve, and strips of spinal cord white matter34-41. These preparations continue to advance our knowledge of white matter injury mechanisms as they allow controlled changes in environmental factors, controlled application of drugs and reagents, functional assessments using electrophysiology, and direct fluorescence microscopy observations of axons and myelin in living tissue. Yet, some previous approaches to observe axons from spinal cord dorsal column strips or ventral white matter strips unavoidably injure surface axons during the removal stage that may influence the response of closely opposed axons. To capitalize on the experimental manipulations above and avoid damage to the very fibers under investigation, we use an ex vivo cervical spinal cord model as it prevents direct contact of the dorsal aspect of the cord. Thus, the architecture of the pia mater and adjacent superficial dorsal column axons remain viable and unperturbed during isolation.
Here we describe a relatively simple approach that allows direct visualization of central myelinated axons as they dynamically respond to a focal injury in real-time up to 8 - 10+ hr after injury. The laser-induced spinal cord injury (LiSCI) model allows differentiation between primary and secondary axonal injury mechanisms as the primary lesion (ablation site) remains spatially constrained over time. The open-bath imaging chamber is accessible to therapeutic intervention, reagent delivery, and environmental manipulations. Putative axomyelinic protective agents can be quickly assessed in real-time by direct observations versus lengthy and costly experiments involving tissue processing, sectioning, immunostaining, image capture, and analysis and therefore provides a useful surrogate model to assess acute responses and protective manipulations before testing the experimental agents in live animals.
Protocol
NOTE: All animal procedures were performed under guidelines set by the Institutional Animal Care and Use committee at the University of Louisville, adhering to Federal regulations.
1. Preparation of Low Ca2+ and 2 mM Ca2+ Artificial Cerebrospinal Fluid (aCSF) Perfusates
- Prepare 2x low Ca2+ (0.1 mM) Stock C buffer, 2x normal Ca2+ (2 mM) Stock A buffer, and 2x Stock B buffer as described in Table 1. The individual stock solutions allow modification of ion content (e.g., low or zero Ca2+) and can be stored at 4 °C for up to one month.
- For intracardiac perfusion during dissection, add 100 ml of 2x low Ca2+ Stock C and 100 ml of 2x Stock B into a plastic bottle to make 1x low Ca2+ aCSF. Mix and store overnight at 4 °C or make fresh.
- For perfusion of ex vivo spinal cord during imaging, add 500 ml of 2x normal Ca2+ Stock A and 500 ml of 2x Stock B into a 1 L glass bottle to generate 1x aCSF. Mix and store overnight at room temperature or make fresh.
- Adjust pH of aCSF buffers to 7.4. While keeping the aCSF at room temperature, place the low Ca2+ aCSF on ice and then bubble both buffers with carbogen gas (95% O2; 5% CO2) for 30 min prior to use and continuously during perfusion.
2. Preparation of Ex Vivo Imaging Chamber
- Wrap a heating blanket (no automatic shut off) around the aCSF bottle and adjust heat to low/ medium setting.
- Insert a dedicated aCSF perfusion line into the bottle connected to a perfusion pump and in-line heater which is controlled by a bipolar temperature controller and feedback temperature probe as shown in Figure 1A.
- Attach a flat microscope stage insert (152 x 102 mm) to the 2-photon excitation/confocal microscope stage fitted with a spill container.
- Place a large open-bath perfusion chamber (W x L x H; 12 x 24 x 8 mm) into the spill container to accommodate and provide continuous flow of fresh oxygenated aCSF to the ex vivo spinal cord (see Figure 1B for a suitable ex vivo imaging chamber design).
- Connect the in-line heater’s metal output port to the ex vivo imaging chamber using suitable tubing. Place a thin absorbent pad underneath the ex vivo imaging chamber to help maintain the temperature of the buffer/tissue during imaging.
- Adhere the ex vivo imaging chamber to the bottom of the spill container/stage insert using removable sticky tack. The malleability of the sticky tack will allow the chamber to be adjusted as needed to ensure the objective’s light path is perpendicular to the tissue surface. If necessary, use a bullseye level to adjust the chamber.
- Secure an in-line heater feedback temperature probe near the chamber fluid inlet and a stainless steel suction tube connected to a vacuum line at the chamber outlet. Magnetic tape and appropriate micropipette holders are useful in this regard. Turn on the vacuum source.
- Turn on the perfusion pump to start filling the imaging chamber with oxygenated aCSF. Set the perfusion pump to 1.5-2 ml per min.
- Control the volume of aCSF in the imaging chamber by adjusting the vacuum line. It is important that there be enough aCSF in the imaging chamber to cover the spinal cord segment and allow sufficient working distance between a water dipping objective and the tissue surface. Myelin and axons can be detrimentally affected if the tissue segment is not completely submersed in fresh oxygenated aCSF leading to experimenter-induced artifacts.
- Adjust the in-line heater temperature controller so that perfusate temperature in the imaging chamber is near room temperature.
3. Dissection of Adult Murine Cervical Spinal Cord
- Euthanize an adult 6-10 week old thy1-YFP transgenic mouse (use appropriate strain that has fluorescent protein expression in dorsal root ganglion neurons) by injecting an overdose of the anesthesia sodium pentobarbital (200 mg/kg) via intraperitoneal injection.
- Once under the proper level of anesthesia (e.g., no reaction to toe pinch and loss of blink reflex), carefully shave the skin overlying the spinal cord and brain with surgical clippers. Cleanse skin using betadine and 70% ethanol pads.
- Spray chest/abdomen area with 70% ethanol, then perfuse the subject transcardially using chilled, carbogen-bubbled low Ca2+ aCSF. (See Figure 1C for suggested dissection bench top set up).
- As the liver pales, secure the perfusion needle into the heart using a small clip. Turn the subject over to access the shaved dorsal side of the subject and wipe the shaved area with 70% ethanol.
- Make a dorsal skin incision along the midline starting from the nose to hip using dissection scissors to expose the brain and vertebral column (Figure 2A). Secure the preparation by placing pins at the nose and haunch.
- Using a dissection microscope from this point on, firmly cut across the dorsal surface of the skull at the level of the olfactory bulbs. Insert one of the scissor tips into the lateral edges of the incision and cut along the edges of the skullcap bilaterally until the cerebellum.
NOTE: Do not completely excise the skullcap as it is needed later to lift the overlying tissue from the spinal cord throughout the dissection (see Figure 2B). - Lift the skullcap to expose the brain. Gently cut the left and right edges of the interparietal bone (located at the cerebellum) and pull it back caudally to expose the brainstem/spinal cord (Figure 2C).
- Use fine tipped scissors held at a 45° angle to the table surface and cut the vertebrae bilaterally just inferior to the posterior nerve roots.
NOTE: Avoid contact with the bright white dorsal columns. These fibers are the ones that will be imaged (Figure 2D) and can be easily damaged. - Lift the skullcap and dorsal surface of the vertebral column with fine tipped forceps, gently pulling the overlying tissue in one piece as cuts are made to expose the spinal cord. Continue to cut vertebrae to the upper thoracic level to isolate a 1-2 cm segment of the cervical cord for subsequent imaging (Figure 2E).
- Use scissors to cut the tissue/bone parallel to the vertebral column and clear tissue underneath the column. Make these cuts as level as possible. It is very important that the tissue lies flat in the chamber so that the cord is level for imaging.
- Use a #11 scalpel to transect the brain stem (past the termination of the gracile fasciculus fibers) and at the upper thoracic level to isolate the cervical spinal cord segment (See Figure 2F). Use scissors to cut tissue/bone at these same two points. The isolated tissue should contain 2/3 of the vertebral column encompassing the caudal brainstem, cervical enlargement, and upper thoracic spinal cord (Figure 2G).
- Place the isolated spinal column into a petri dish of carbogen-bubbled, chilled low Ca2+ aCSF. If needed, trim the tissue underneath the spinal column until it lies flat in the dish.
- Transfer the isolated spinal column to the ex vivo imaging chamber and gradually increase the perfusate temperature over 1 hr to 36 - 37 °C. Maintain this temperature during imaging.
4. Placement of Ex Vivo Spinal Cord into Imaging Chamber and Myelin Labeling with Nile Red
- Carefully secure the vertebral column in the imaging chamber with an appropriate fitting slice hold down modified with a vertical grid platform consisting of fine Lycra threads (remove middle threads of grid platform to allow space for the spinal cord; see Figure 3A).
- Thaw an aliquot of Nile Red (5 mM stock in DMSO and 0.22 μm filtered; can be stored for 1 month at 4 °C, or 6 months at -20 °C in the dark). Just before adding Nile Red to the imaging chamber, reduce the flow of the perfusion pump and adjust the vacuum line to ensure the fluid in the chamber always covers the spinal cord.
- Add 5-10 µl Nile Red stock solution to the imaging chamber near the caudal end of the cord (Figure 3B). Use a 1 ml pipette to gently mix Nile Red throughout the chamber. Allow Nile Red to stay in chamber for 1-2 min, then place vacuum line back and adjust perfusion pump to 1.5-2 ml per min to continuously perfuse the spinal cord.
- Carefully raise the microscope stage and align the objective with the center of the spinal cord segment and medially over the dorsal columns until the water immersion objective is approximately 10 mm from the surface of the aCSF in the chamber. Use the microscope nosepiece focus wheel to slowly bring the objective down until it gently touches the surface of the aCSF. Use an epifluorescent light source to focus the dorsal columns into the field of view (Figure 3C).
5. Ex Vivo Imaging of the Mouse Spinal Cord with TPLSM and Laser-induced Spinal Cord Injury (LiSCI)
NOTE: The posterior vein provides a useful marker to center the tissue as the gracile fasciculus fibers (originate from cell body of dorsal root ganglia and ascend from T6 and below along the midline of spinal cord) run parallel to this blood vessel. The thicker YFP+ cervical dorsal root projections also provide a useful marker as the fibers ascend and descend laterally to the YFP+ gracile fasciculus fibers that are smaller in diameter.
- Once the spinal cord tissue is aligned appropriately, switch to laser scanning mode to perform baseline imaging of the ascending gracile fasciculus myelinated fibers. To excite both YFP and Nile Red, use a two-photon laser source tuned to 950 nm wavelength (~17 mW measured at the exit of a 25X, 1.1 NA objective) and appropriate dichroics (DM) and bandpass filters to isolate the fluorescent emission of the fluorophores (we use 525/50 DM560, 600/60 DM640, and 685/70, to separate YFP, and Nile Red into yellow-orange, and extended red channels, respectively).
- If more than 3% of the axons show axonal spheroids during baseline imaging (30-60 min), discard the preparation due to experimenter-induced artifacts.
- Induce a LiSCI by magnifying the field of view to 30.3X (to create a ~20 μm diameter ablation). Tune the laser to 800 nm, and increase the power of the laser to ~110 mW at the sample. Allow 5 complete field of view laser scans to ensure fibers are completely transected.
- Confirm LiSCI by changing laser settings back to imaging settings (950 nm, 17 mW at the sample, 2.08X) and scan the tissue to visualize the ablation. Verify the diameter of the ablation and that the primary ablated axons are completely transected (see Figure 3D). Use time-lapse settings on the microscope combined with z capture to record the dynamic response of axons and myelin to injury up to 8-10+ hr after injury.
NOTE: If the ablation is incomplete (i.e., incomplete transection of fibers), discard the preparation, as determination of primary and secondary injury mechanisms will be confounded. In addition, isolated spinal cord segments can be imaged up to 24 hr post-LiSCI with only mild to moderate LiSCI-independent tissue damage.
Representative Results
Details of an appropriate laboratory set up needed to isolate, maintain viability, and image the ex vivo spinal cord is shown in Figure 1. The microscope needs to be equipped with a tunable pulsed femtosecond laser, appropriate dicroics and emission filters, and a water-dipping objective lens with a high numerical aperture(≥1.0). To ensure viability of the spinal cord during the dissection, the procedure should be performed in the presence of chilled oxygenated low Ca2+ aCSF that allows enough Ca2+ for the isolated axonal membranes to seal 42. Failure to do so can cause axomyelinic damage including separation of myelin from the axolemma and axonal spheroid formation clearly visible during baseline imaging. Representative images of the dissection process and isolation of the ex vivo spinal cord is shown in Figure 2. Following isolation the viability of the spinal cord is maintained by continuous perfusion of oxygenated aCSF which is kept at 36-37 °C. The myelin stain Nile Red 27,43 can then be added to the perfusion chamber, and baseline recordings of the gracile fasciculus myelinated axons can commence (Figure 3).
Representative images of gracile fasciculus myelinated axons are shown in Figure 4. Under baseline conditions timelapse TPLSM recordings reveal parallel-aligned YFP+ axons ensheathed in myelin (Nile Red) with largely constant diameters along the length of the axon. Few axonal spheroids or other morphological signs of axonal degeneration are present. Due to the solvatochromic properties of Nile Red and the lipid and protein content of myelin, myelin is stained yellow-orange whereas rows of putative oligodendrocyte cell bodies appear darker orange (Figure 4A). Fine details such as nodes of Ranvier can also be resolved (e.g., arrows in Figure 4A).
At 10 min following LiSCI, immediately transected axons (primary injury) located rostral and caudal to the ablation site begin to retract away from the injury site and form sigmoidal-like coils within swollen ballooning myelin. Myelin ensheathing axons remote to the ablation appear unchanged at this time point. By 40 min post-LiSCI most primary transected axons and axons undergoing secondary degeneration (i.e. initially spared from the insult but later degenerate) form characteristic endbulbs as they retract from the lesion site (Figure 4B). Approximately a third of these transected axons undergo pan-fragmentation where the proximal segment first swells, forms axonal spheroids, and eventually transects the axon into several irregular lengths of axon43. Separation of myelin from the axons (peri-axonal swelling) and vesicular degeneration of myelin is also evident. Over time, primary and secondary transected axons continue retracting away from the lesion site, axons immediately flanking the ablation site undergo secondary degeneration, and peri-axonal swelling becomes more prominent as well as myelin swelling and vesicular degeneration (Figure 4D-G, see also 43). A clear difference in the extent of axonal retraction becomes apparent between proximal axonal stumps (caudal to lesion) and their distal segments (rostral to lesion) that are destined to undergo Wallerian degeneration (Figure 4D-G). Axons initially spared by the LiSCI undergo delayed secondary degeneration (Figure 4H). A representative control experiment without LiSCI, suggests that long imaging sessions (up to 13 hours after cord isolation in this example) are possible without causing adverse effects to white matter integrity (Figure 4I, J).
Representative high-resolution images of axomyelinic changes after LiSCI are shown in Figure 5.
By 3 hr after LiSCI, several proximal (caudal) axons have retracted away from the lesion site where they remain within swollen myelin tubes that have separated away from the axon. Other axonal endbulbs appear to be capped by myelin (Figure 5A). Axons adjacent to the ablation site undergo secondary degeneration whereas others appear unaffected. YFP low/negative putative vesicles (pale blue) within the axon and axonal endbulbs are also present. In contrast to caudally retracting fibers, the majority of the rostrally retracting axonal endbulbs and spheroids at 3 hr post-LiSCI are strongly labeled with Nile Red (less blue shifted) indicative of an environmental change within the axon (Figure 5B). Nile Red-labeled areas within the actively retracting axons appear to mainly surround or cap the axonal core. Although the precise location and identity of these intra-axonal Nile Red-labeled structures are currently unknown, they may represent dense vesicle accumulation via axonal transport and/ or cleaved proteins exposing their hydrophobic core 27. Nile Red labeled myelin remains mainly yellow-orange in normal appearing myelin. In distinction, Nile Red probed vesicular myelin appears yellow (i.e. blue shifted) indicative of environmental changes within these structures. By 7 hr after LiSCI axons continue retracting away from the lesion site; however, this is more evident in rostral (Figure 5D) versus caudal (Figure 5C) endbulbs. Other axons undergo complete or partial disintegration leaving an empty myelin tube or a thin stalk several microns away from the degenerating segment. Delayed application of Nile Red after LiSCI reveals similar axonal labeling as pre-application of Nile Red suggestive that the ablation per se and potential thermal effects on protein denaturation is unlikely responsible for the Nile Red spectral shifts in myelin and axons after injury (Figure 5E, F).
Collectively, these data illustrate the usefulness of the ex vivo LiSCI model to mimic well known but poorly understood mechanisms of acute axomyelinic injury in real-time. The model may therefore be useful to further our knowledge of the pathophysiology of white matter injury, and uncover key molecular targets to preserve white matter integrity.
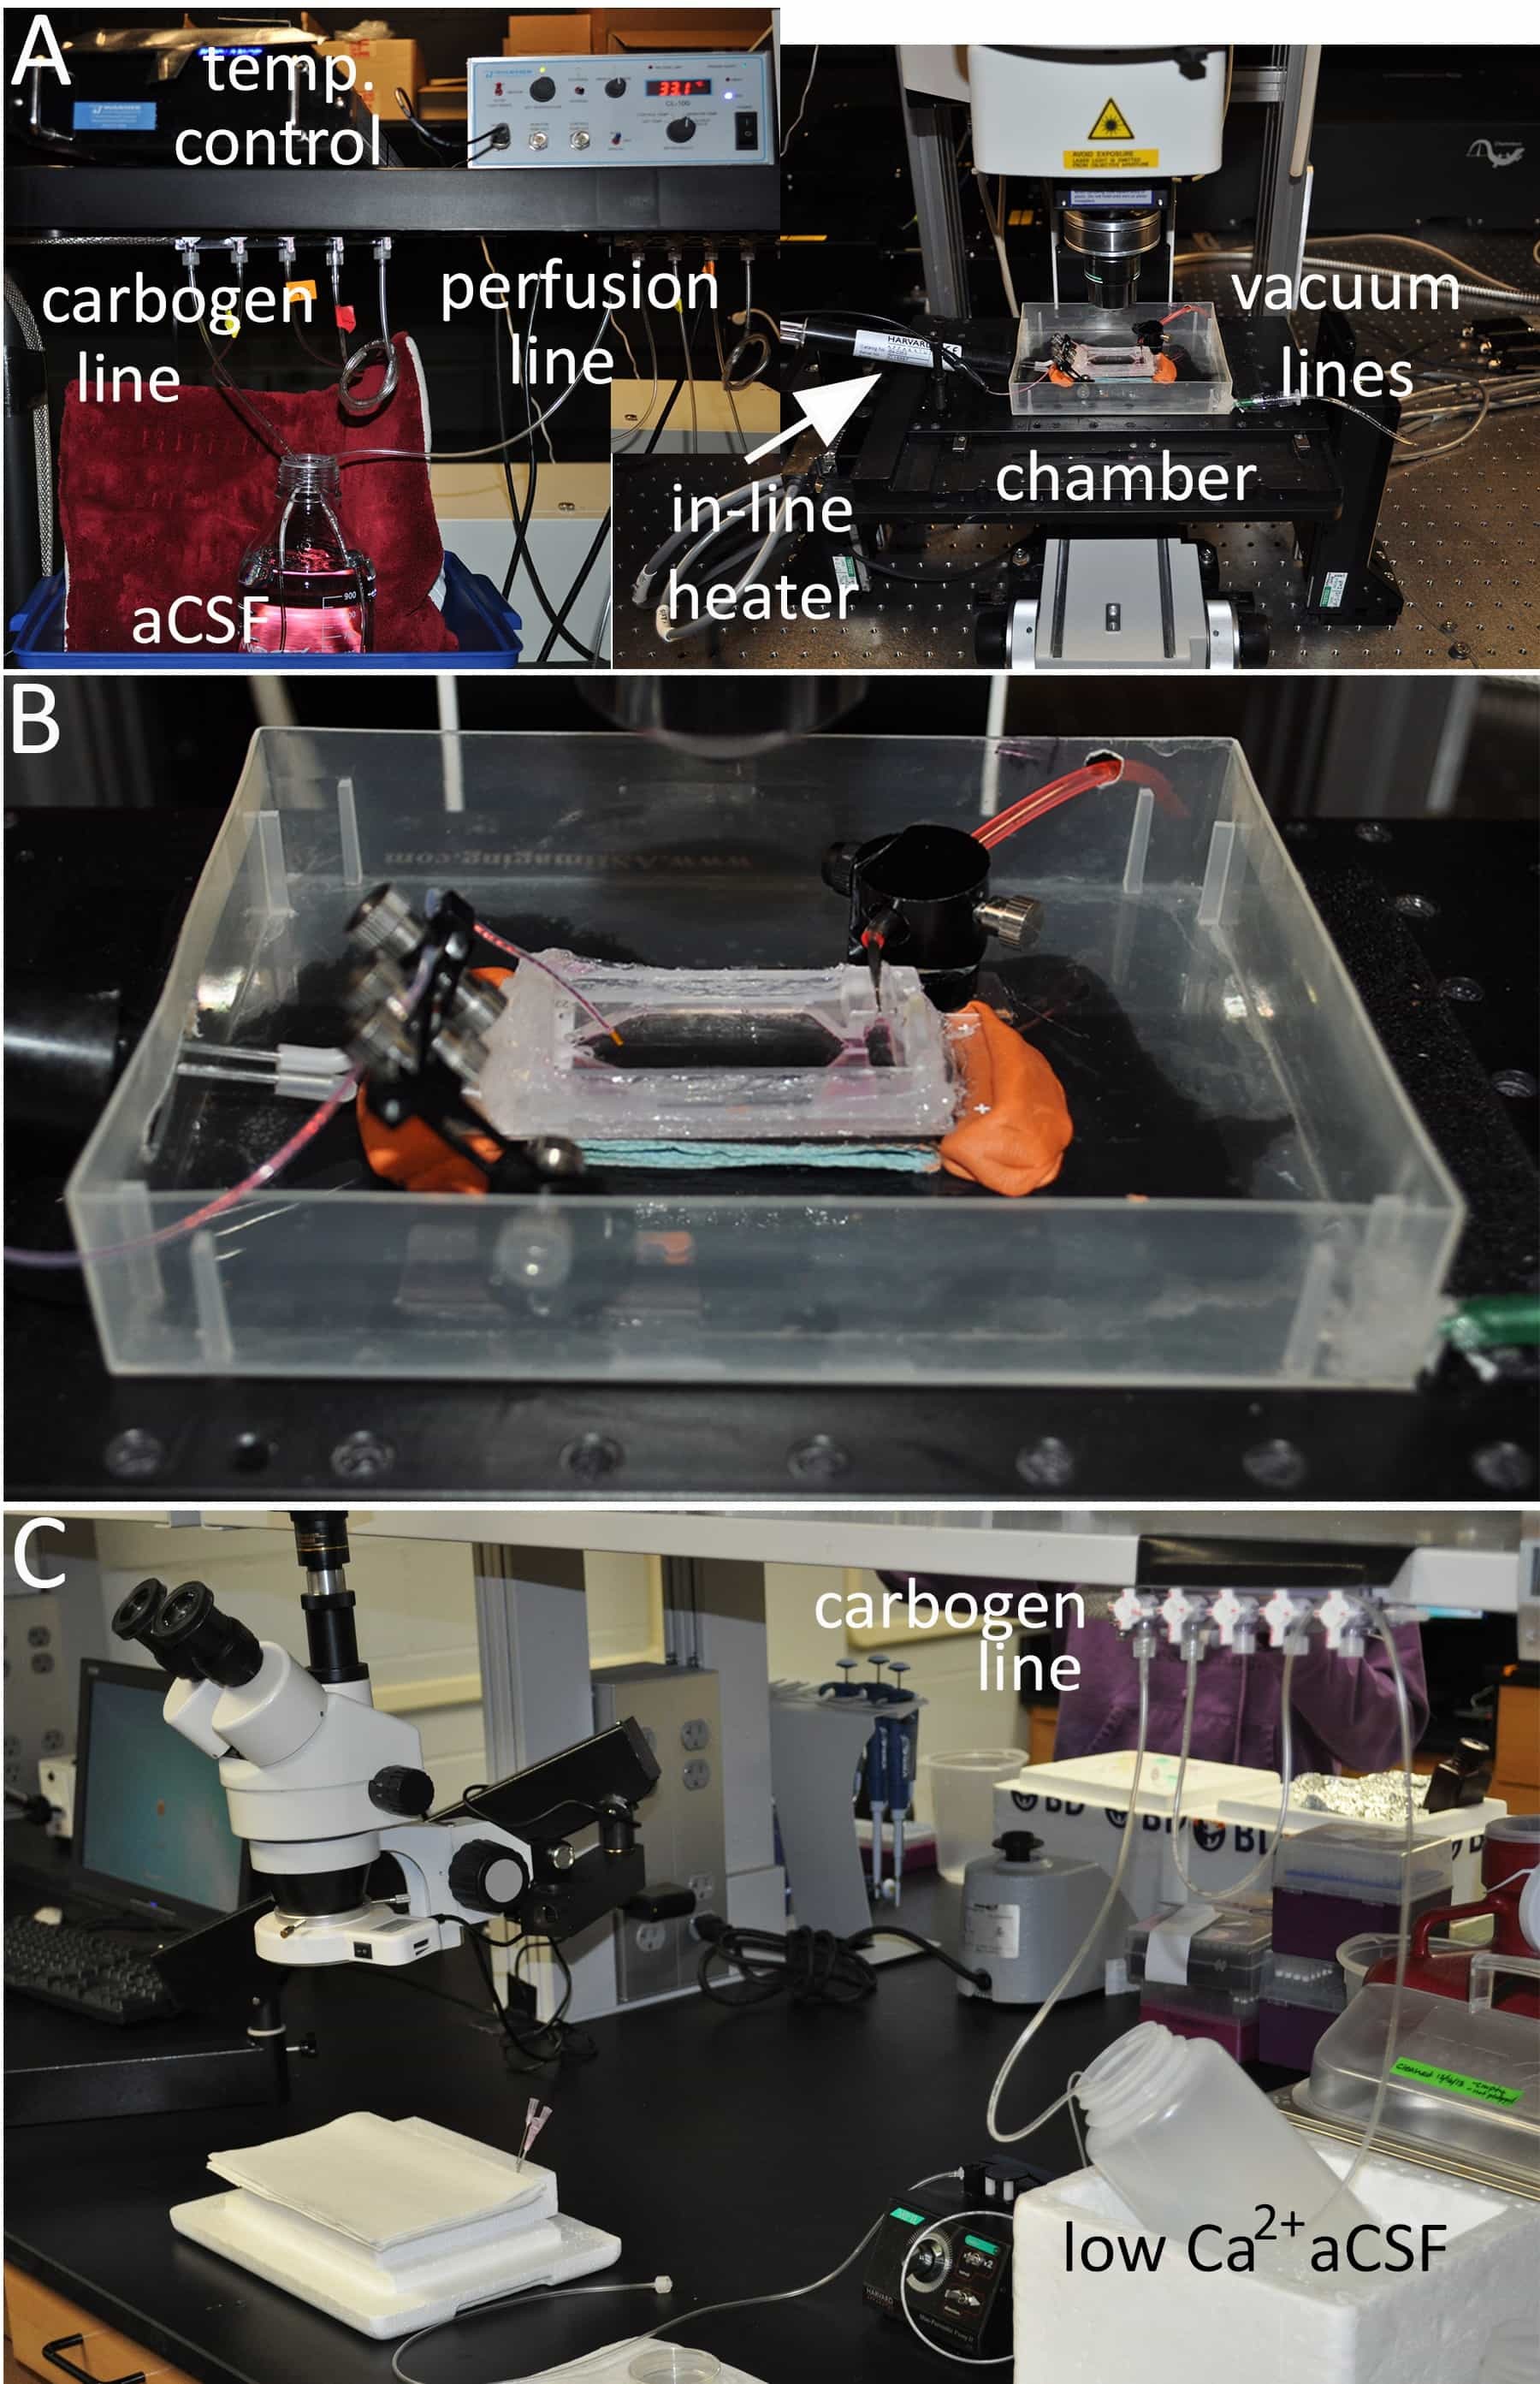
Figure 1: Overview of the dissection and imaging setup. (A) A suggested set-up for ex vivo imaging of the spinal cord. The major equipment necessary includes a carbogen (95% O2/ 5% CO2) gas line to oxygenate the aCSF, a perfusion pump to deliver the carbogen-bubbled aCSF through an in-line heater/ temperature controller device equipped with a temperature feedback probe, and an open-bath designed imaging chamber fitted with a vacuum source. (B) A higher magnification of the imaging bath chamber is shown. (C) A suggested set-up for perfusion and dissection of the ex vivo spinal cord. Chilled low Ca2+ aCSF is oxygenated with carbogen and used to maintain viability of the spinal cord during dissection.
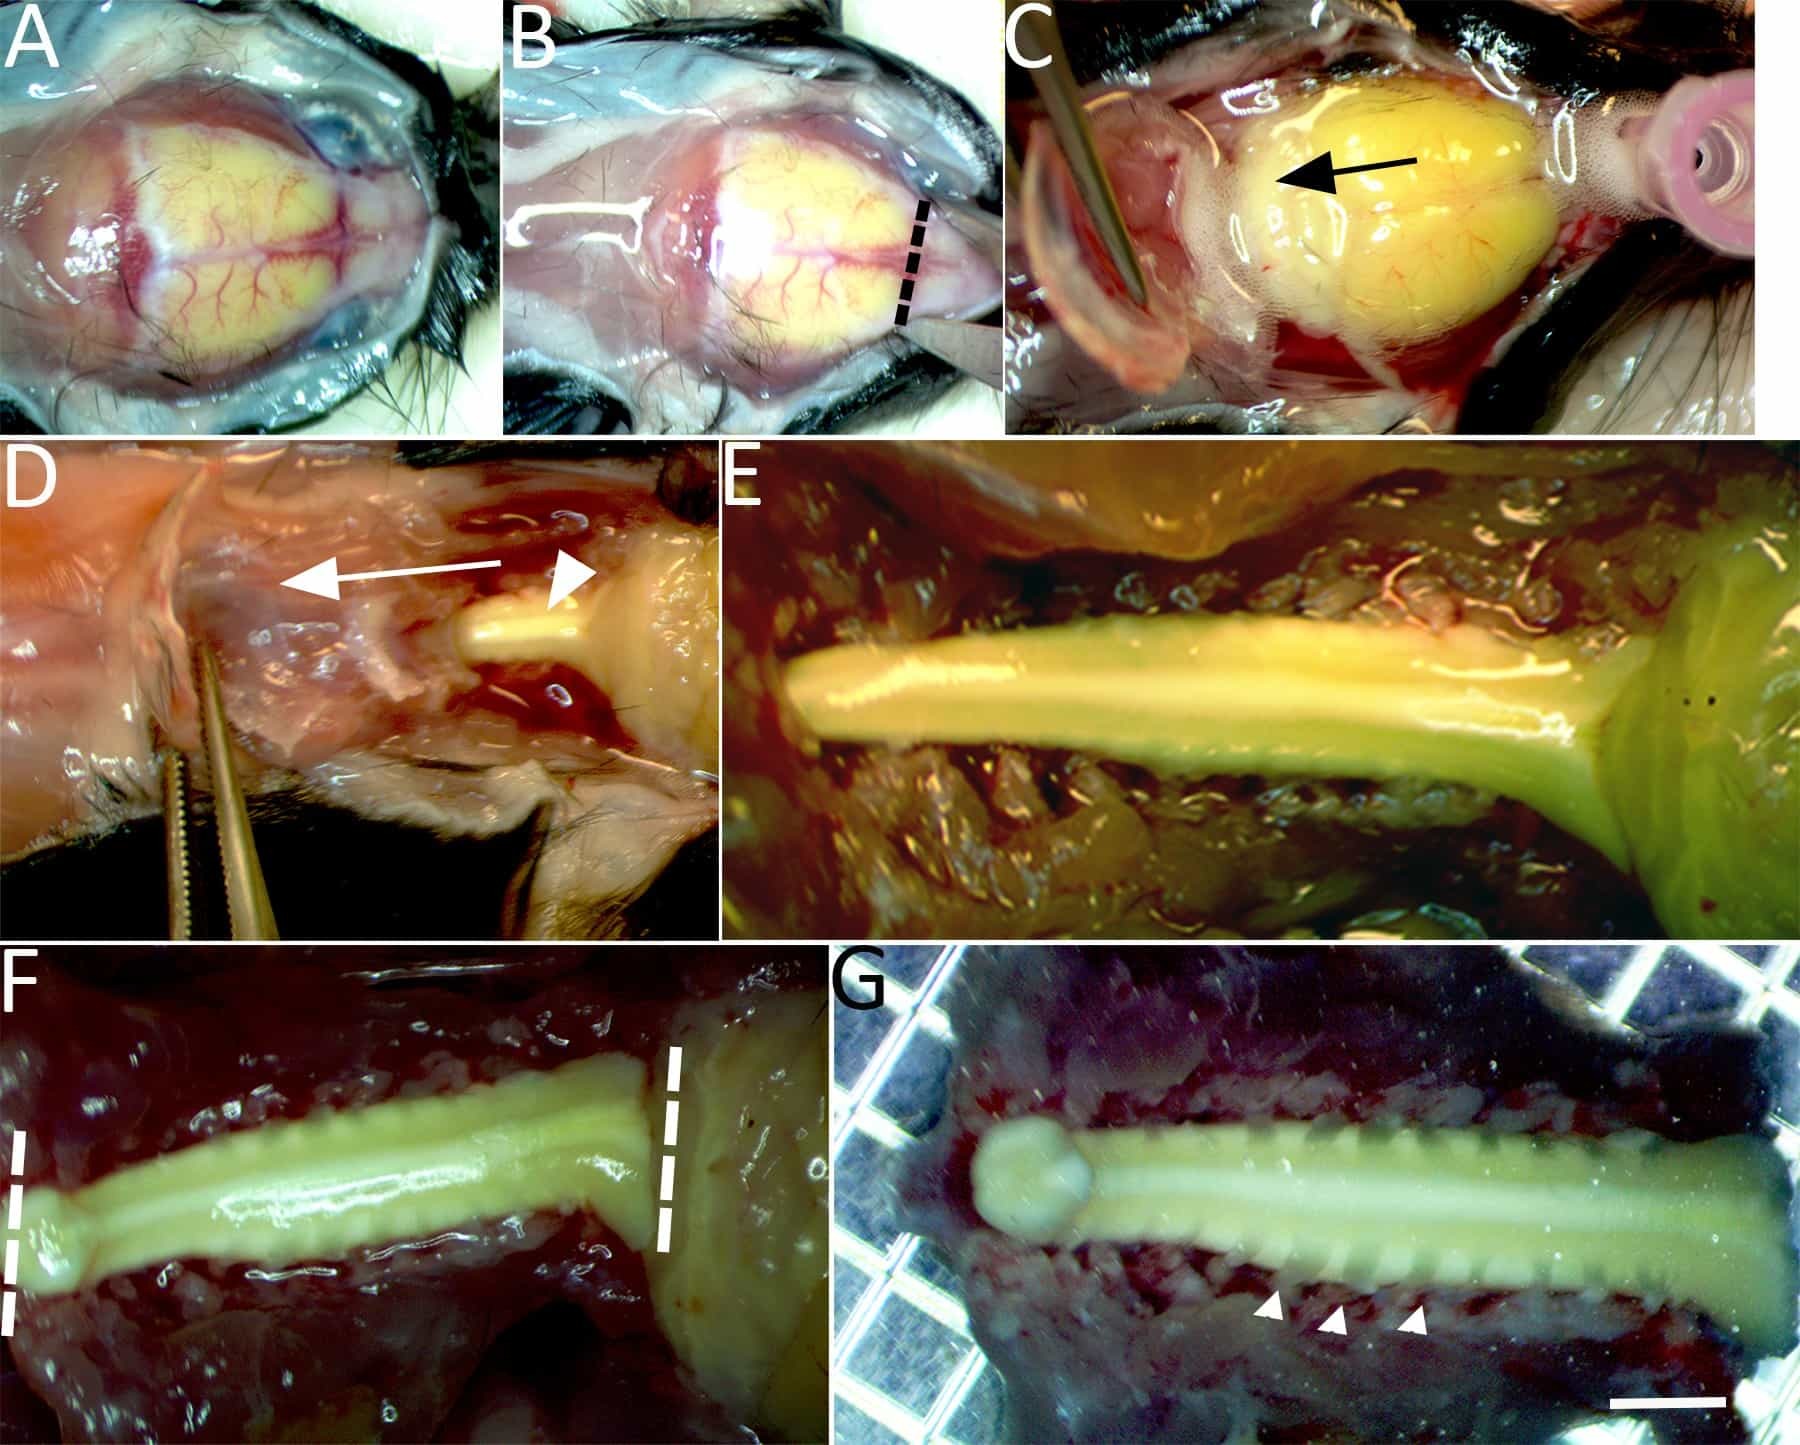
Figure 2: Isolation of the spinal cord for imaging. (A) Under continuous chilled, oxygenated low Ca2+ perfusion the skullcap is exposed. (B) An incision is made through the dorsal surface of the skull at the level of the olfactory bulbs (dashed line). (C) Bilateral incisions are then made through the lateral borders of the skullcap until it can be gently lifted and pulled caudally (in the direction of the arrow) to expose the brain stem. (D) Continue bilateral incisions with fine tipped scissors to cut the lateral aspects of the vertebrae and expose the dorsal columns (arrowhead). (E)The exposed brainstem and entire cervical enlargement to the upper thoracic segment of spinal cord are shown. (F)Two incisions with a number 11-scalpel blade are made to isolate the spinal cord at the brainstem, beyond the gracile fasciculus axonal terminations and upper thoracic level (dashed lines). (G) The isolated spinal cord is then transferred to a petri dish containing chilled low Ca2+ aCSF bubbled with carbogen gas. Cervical dorsal roots (e.g., arrowheads), dorsal root ganglion, and the spinal cord from the upper thoracic segment to the brainstem (~15-20 mm) are left intact. Scale bar in G: 2 mm.
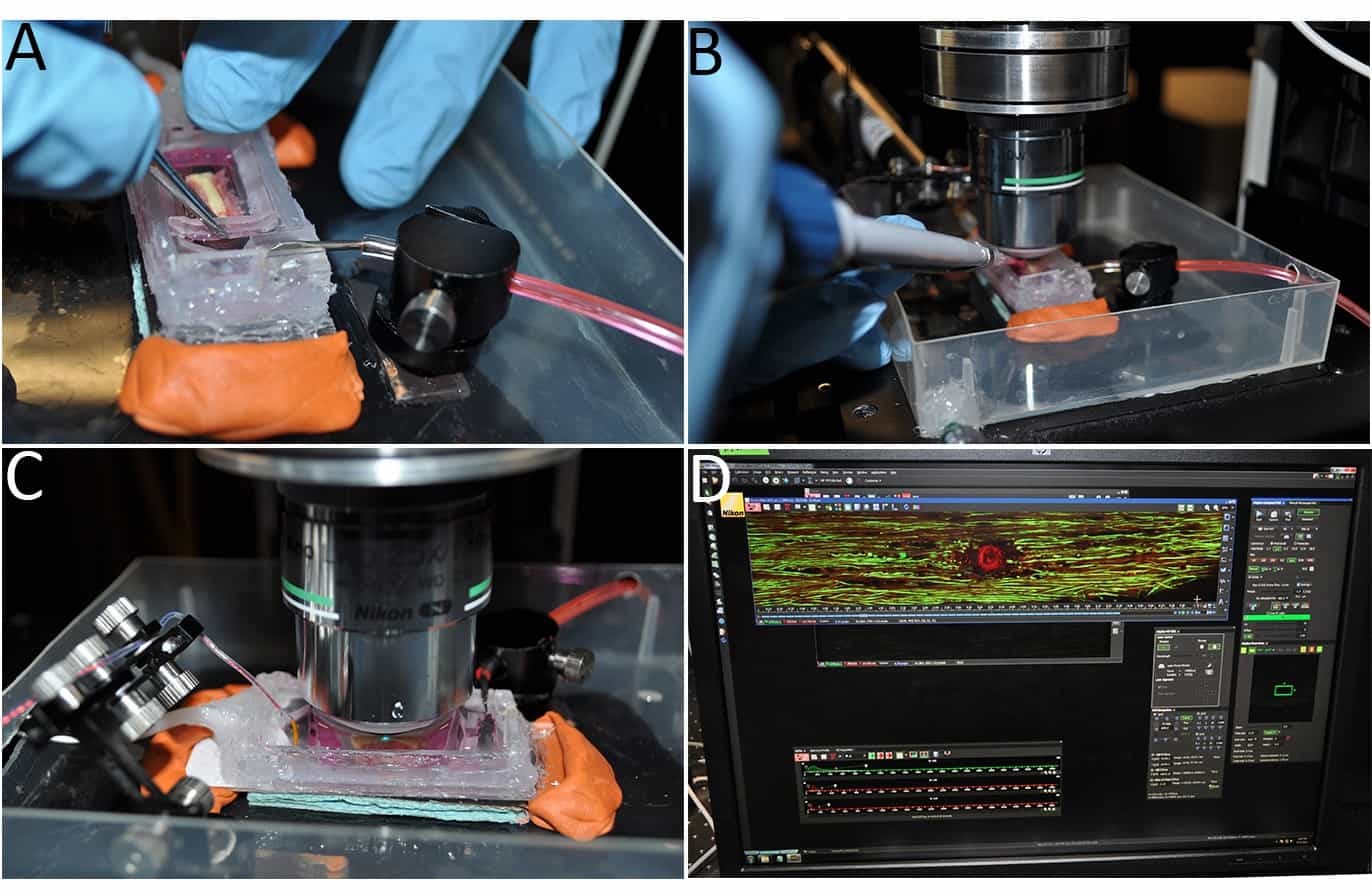
Figure 3: Imaging the ex vivo spinal cord. (A) Once placed in the chamber, the spinal cord tissue is secured using a modified tissue/slice hold down fitted with Lycra threads. (B) The myelin stain Nile Red is added directly to the imaging chamber. (C) A water immersion objective is submerged into the aCSF and positioned over the gracile fasciculus fibers. (D) A representative image of LiSCI captured using TPLSM is shown.
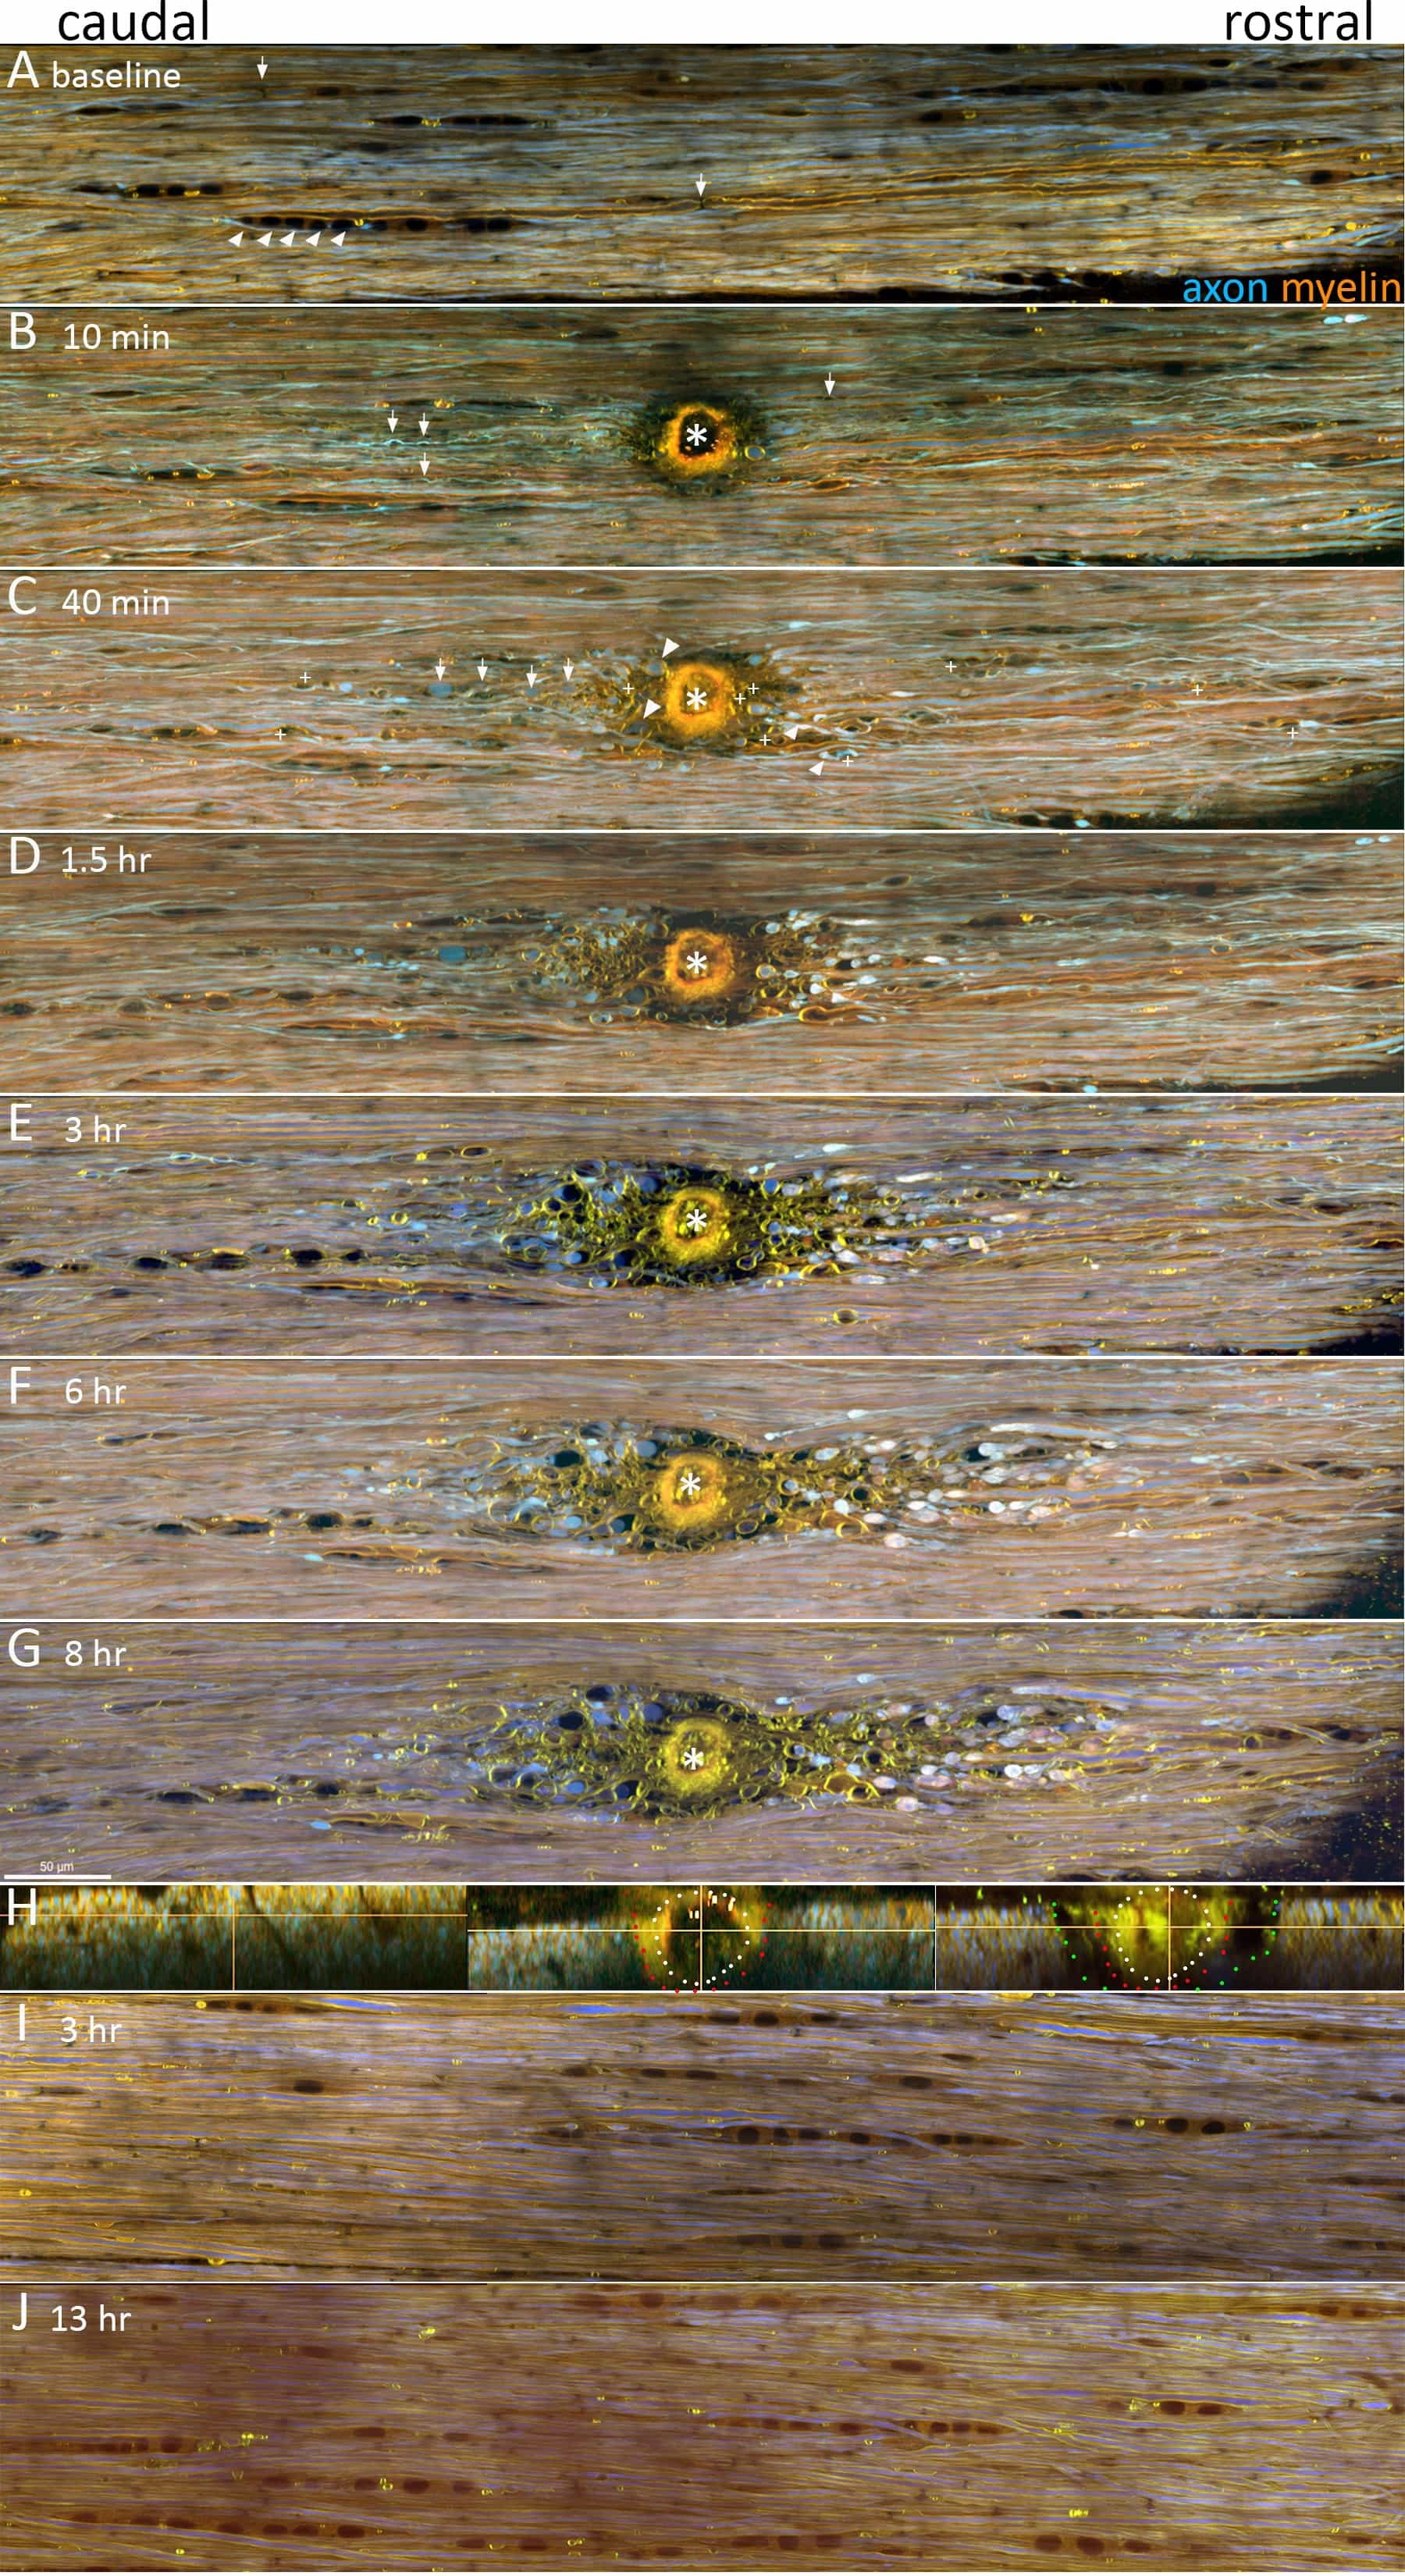
Figure 4: LiSCI model of central myelinated axon injury. TPLSM was used to capture the dynamics of axon and myelin responses following LiSCI (*). Representative images are displayed as maximum intensity projections of five 1 μm thick optical sections captured at 0.24 μm/pixel with a Nikon A1RMP+ multiphoton/confocal microscope equipped with a 25X; N.A.: 1.1; W.D.: 2 mm water immersion objective. Standard dichroics and emission filters were used to separate YFP+ axons (525/50 DM560, shown in blue) and the solvatochromic lipophilic fluorescent dye Nile Red into shorter (600/60 DM640, shown in green) and longer (685/70 nm, shown in red) emission channels. The two latter filter combinations are advantageous as they capture Nile Red’s known spectral shifts in different physico-chemical environments. (A) In baseline conditions axons (YFP+, blue) and myelin (NR, yellow-orange) appear normally orientated with few spheroids or other signs of axomyelinic injury. Rows of glia with characteristic morphology of white matter oligodendrocytes (NR, dark orange, e.g. arrowheads) are also visible (some marked for clarity), and fine structures such as nodes of Ranvier are also resolved (e.g. arrows). (B) At 10 min after LiSCI, transected axons located rostral and caudal to the lesion begin to retract away from the injury site and form sigmoidal-like coils (arrows) within swollen myelin. Myelin ensheathing axons remote from the ablation appear unchanged at this time point. (C) By 40 min post-LiSCI most primary transected axons and axons undergoing secondary degeneration form characteristic endbulbs as they retract from the lesion site (arrowheads). Some transected axons also form spheroids along the length of their axons (arrows). Separation of myelin from the axon (peri-axonal swelling) and vesicular degeneration of myelin is also evident (+). (D-G). Over time, primary and secondary injured axons continue retracting away from the lesion site, and as shown by yz projections of the LiSCI, initially spared axons flanking the ablation site undergo delayed secondary degeneration (H, left panel before LiSCI, middle panel 10 minutes post-LiSCI, and right panel 7 hr after LiSCI; white dots mark the initial LiSCI, red dots indicate the loss of axons by 10 min and green dots indicate the extent of delayed secondary degeneration of axons by 7 hr). Peri-axonal swelling becomes more prominent at later time points post-LiSCI. The extent of axonal retraction and morphology of axonal endbulbs between proximal axon stumps and their distal segments also becomes apparent (Also see Figure 5 for higher magnification images). Scale bar: 50 μm.
| 2x Stock A (2 mM Ca2+) | Reagent | mM |
|---|---|---|
| NaCl | 252 | |
| KCl | 6 | |
| CaCl2 • 2H2O | 4 | |
| 2x Stock B | NaH2PO4 | 2.5 |
| MgSO4 | 4 | |
| NaHCO3 | 52 | |
| Dextrose (D-Glucose) | 20 | |
| 2x low Ca2+ Stock C (0.1 mM Ca2+) | NaCl | 252 |
| KCl | 6 | |
| MgCl • 6H2O | 3.8 | |
| CaCl2 • 2H2O | 0.2 |
Table 1: Artificial cerebrospinal fluid (aCSF) buffers.
Discussion
We describe a method of imaging ex vivo spinal cord myelinated axons (i.e., gracile fasciculus) combined with a laser-induced spinal cord injury to study the dynamic progression of both primary and secondary myelinated axonal degeneration over time. Ex vivo imaging of the surface of the spinal cord overcomes many of the complications associated with in vivo imaging such as motion artifacts and the potential of experimenter-induced hypoxia during prolonged imaging sessions. This protocol isolates the entire cervical segment of spinal cord using oxygenated perfusates containing low Ca2+ and avoids damage of the overlying axonal fibers, a commonly encountered setback during dorsal column or ventral white matter strip preparations. Additionally it enables the researcher to manipulate the isolated spinal cord’s microenvironment prior to or following spinal cord injury (e.g.,modification of Ca2+ concentration and/or addition of pharmaceutical reagents).
In contrast to the transection, contusion, or crush SCI models that affect a wide area of axons, the highly focused nature of LiSCI allows simultaneous study of the primary injury (transected axons) and the later occurring secondary axonal damage. The described ex vivo imaging and LiSCI protocol can be utilized to investigate other components of white matter injury including demyelination, neuroinflammation induced by CNS-residing immune cells including microglia, and anoxic/ ischemic injury mechanisms. These studies could also focus on the dorsal column axons as in the current protocol or modifications could be made to image other superficially located spinal white matter tracts. Additionally, other transgenic or double transgenic mice strains may also be used with this protocol to study activation/activities of CNS-residing cells.
There are several critical considerations for successful isolation and imaging of a murine ex vivo spinal cord. First, the aCSF buffers need to be kept oxygenated to prevent hypoxia. The spinal cord should be kept moist by being submerged in the oxygenated aCSF during and after isolation. During dissection, it is best to minimize mechanical stress on the spinal cord such as excessive pressure from pulling back the overlying tissue too firmly and stretching/bending the spinal cord when clearing the tissue underneath the spinal column segment. Moreover it is crucial to never touch/compress the spinal cord dorsal columns. Maintaining the optimal aCSF perfusate temperature in the imaging chamber is also important since a hyperthermic environment may stress the spinal cord tissue.
To ensure that the axons are completely transected during LiSCI, it is important to immobilize the tissue segment in the ex vivo chamber to minimize potential tissue movement during the laser ablation. Additionally the tissue at the desired ablation site should lie flat in the imaging chamber (perpendicular to the objective lens). LiSCI performed on tissue that is not level leads to a tilted ablation which complicates subsequent image analysis and decreases the overall image clarity. Finally, the tissue depth of the laser ablation may affect the LiSCI results. We suggest setting the focal point for the ablation to be around 12-15 μm below the pia mater.
A major limitation for using this ex vivo imaging model to examine axon and myelin injury mechanisms is that the effects of peripheral blood-derived cells following LiSCI cannot be determined. Furthermore, since this is a terminal model, behavioral and regeneration outcomes following the injury cannot be evaluated. A constraint to this ex vivo LiSCI imaging model that is shared with in vivo imaging is the depth that is capable of being resolved due to the strong light scattering properties of the spinal cord white matter. Thus, this ex vivo spinal cord imaging model primarily focuses on the central projections ascending from the dorsal root ganglion sensory neurons which are the most accessible fibers to visualize since they are located along the dorsal surface of the spinal cord. Other myelinated axonal tracts such as descending motor axons may react differently after injury compared to the ascending sensory axons documented in this protocol. Another shared limitation for imaging both in vivo and with our ex vivo imaging protocol is the imaging duration. While this ex vivo method is an excellent means of studying acute injury mechanisms, imaging long-term longitudinal axonal changes in the same ex vivo tissue segment may be infeasible. We normally image the isolated spinal cord tissue for 6-10 hr after LiSCI without any notable LiSCI-independent tissue damage; however, we have imaged a spinal cord segment up to 24 hr post-LiSCI with only moderate tissue degradation unrelated to the induced injury. However, if a spinal cord segment was imaged for longer periods of time, there would inevitably be some tissue breakdown that is independent from the laser ablation. Despite these limitations in our proposed ex vivo spinal cord LiSCI model, the knowledge that can be gained from this ex vivo spinal cord imaging and LiSCI model -from the novel ability to distinguish between primary injury and secondary injury in real-time to evaluating the efficacy of pharmaceutical reagents and environmental manipulations after injury- may yield invaluable insight into the mechanisms of the dynamic axonal and myelin responses following injury.
Disclosures
The authors have nothing to disclose.
Acknowledgements
DPS acknowledges past and present support in part from grant #2665 and #2934, respectively, from the PVA Research Foundation. PKS is an Alberta Innovates – Health Solutions Scientist, operating funds were provided by the Leblanc Chair for Spinal Cord Research, University of Calgary.
Materials
| Name | Company | Catalog Number | Comments |
|---|---|---|---|
| Large bath chamber with slice supports | Warner Instruments | RC-27L | For ex vivo imaging chamber |
| Standard Slice Supports | Warner Instruments | SS-3 | For ex vivo imaging chamber |
| Plastic Slice hold-down for RC-27L and RC-29 chambers | Warner Instruments | SHD-27LP/10 | For ex vivo imaging chamber |
| Suction Tube, Series 20 Classic Design, left handed | Warner Instruments | ST-1L | For ex vivo imaging chamber |
| Solution In-line heater/cooler | Warner Instruments | SC-20 | To regulate perfusate temperature during imaging |
| Bipolar temperature controller | Warner Instruments | CL-100 | To regulate perfusate temperature during imaging |
| Liquid Cooling System | Warner Instruments | LCS-1 | To regulate perfusate temperature during imaging |
| Cable assembly for heater controllers | Warner Instruments | CC-28 | To regulate perfusate temperature during imaging |
| Replacement bead thermisitor for CC-28 cable | Warner Instruments | TS-70B | To regulate perfusate temperature during imaging |
| Magnetic holder with suction tubing | Bioscience Tools | MTH-S | To hold the stainless steel vacuum suction tubing |
| Adjustable holder | Bioscience Tools | MTH | To hold the temperature probe |
| clear silicone sealant | For ex vivo imaging chamber | ||
| superglue | For ex vivo imaging chamber | ||
| thin plexiglass strips | For ex vivo imaging chamber | ||
| nile red | Life Technologies | N-1142 | For labeling myelin |
References
- Chew, D. J., Fawcett, J. W., Andrews, M. R. The challenges of long-distance axon regeneration in the injured CNS. Prog Brain Res. 201, 253-294 (2012).
- Eva, R., Andrews, M. R., Franssen, E. H., Fawcett, J. W. Intrinsic mechanisms regulating axon regeneration: an integrin perspective. Int Rev Neurobiol. 106, 75-104 (2012).
- McCall, J., Weidner, N., Blesch, A. Neurotrophic factors in combinatorial approaches for spinal cord regeneration. Cell Tissue Res. 349, 27-37 (2012).
- Pernet, V., Schwab, M. E. The role of Nogo-A in axonal plasticity, regrowth and repair. Cell Tissue Res.349, 97-104 (2012).
- Bradbury, E. J., et al. Chondroitinase ABC promotes functional recovery after spinal cord injury. Nature.416, 636-640 (2002).
- Cregg, J. M., et al. Functional regeneration beyond the glial scar. Exp Neurol. 253, 197-207 (2014).
- Park, K. K., et al. Promoting axon regeneration in the adult CNS by modulation of the PTEN/mTOR pathway. Science. 322, 963-966 (2008).
- Coleman, M. P., Freeman, M. R. Wallerian degeneration, wld(s), and nmnat. Annu Rev Neurosci. 33, 245-267 (2010).
- Sulaiman, W., Gordon, T. Neurobiology of peripheral nerve injury, regeneration, and functional recovery: from bench top research to bedside application. Ochsner J. 13, 100-108 (2013).
- Bradke, F., Fawcett, J. W., Spira, M. E. Assembly of a new growth cone after axotomy: the precursor to axon regeneration. Nat Rev Neurosci. 13, 183-193 (2012).
- Erturk, A., Hellal, F., Enes, J., Bradke, F. Disorganized microtubules underlie the formation of retraction bulbs and the failure of axonal regeneration. J Neurosci. 27, 9169-9180 (2007).
- Seif, G. I., Nomura, H., Tator, C. H. Retrograde axonal degeneration 'dieback' in the corticospinal tract after transection injury of the rat spinal cord: a confocal microscopy study. J Neurotrauma. 24, 1513-1528 (2007).
- Fishman, P. S., Mattu, A. Fate of severed cortical projection axons. J Neurotrauma. 10, 457-470 (1993).
- McPhail, L. T., Stirling, D. P., Tetzlaff, W., Kwiecien, J. M., Ramer, M. S. The contribution of activated phagocytes and myelin degeneration to axonal retraction/dieback following spinal cord injury. Eur J Neurosci. 20, 1984-1994 (2004).
- Stirling, D. P., et al. Minocycline treatment reduces delayed oligodendrocyte death, attenuates axonal dieback, and improves functional outcome after spinal cord injury. J Neurosci. 24, 2182-2190 (2004).
- Kerschensteiner, M., Schwab, M. E., Lichtman, J. W., Misgeld, T. In vivo imaging of axonal degeneration and regeneration in the injured spinal cord. Nat Med. 11, 572-577 (2005).
- Kalb, J., Nielsen, T., Fricke, M., Egelhaaf, M., Kurtz, R. In vivo two-photon laser-scanning microscopy of Ca2+ dynamics in visual motion-sensitive neurons. Biochem Biophys Res Commun. 316, 341-347 (2004).
- Hirase, H., Qian, L., Bartho, P., Buzsaki, G. Calcium dynamics of cortical astrocytic networks in vivo. PLoS Biol. 2, 96 (2004).
- Fenrich, K. K., Weber, P., Rougon, G., Debarbieux, F. Long- and short-term intravital imaging reveals differential spatiotemporal recruitment and function of myelomonocytic cells after spinal cord injury. J Physiol. 591, 4895-4902 (2013).
- Canty, A. J., et al. In-vivo single neuron axotomy triggers axon regeneration to restore synaptic density in specific cortical circuits. Nat Commun. 4, 2038 (2013).
- Dibaj, P., et al. NO mediates microglial response to acute spinal cord injury under ATP control in vivo. Glia.58, 1133-1144 (2010).
- Davalos, D., et al. Stable in vivo imaging of densely populated glia, axons and blood vessels in the mouse spinal cord using two-photon microscopy. J Neurosci Methods. 169, 1-7 (2008).
- Nimmerjahn, A. Two-photon imaging of microglia in the mouse cortex in vivo. Cold Spring Harb Protoc.2012, (2012).
- Nimmerjahn, A., Kirchhoff, F., Helmchen, F. Resting microglial cells are highly dynamic surveillants of brain parenchyma in vivo. Science. 308, 1314-1318 (2005).
- Davalos, D., et al. Fibrinogen-induced perivascular microglial clustering is required for the development of axonal damage in neuroinflammation. Nat Commun. 3, 1227 (2012).
- Buttermore, E. D., Thaxton, C. L., Bhat, M. A. Organization and maintenance of molecular domains in myelinated axons. J Neurosci Res. 91, 603-622 (2013).
- Stirling, D. P., et al. Toll-like receptor 2-mediated alternative activation of microglia is protective after spinal cord injury. Brain. 137, 707-723 (2014).
- Greenspan, P., Fowler, S. D. Spectrofluorometric studies of the lipid probe, nile red. J Lipid Res. 26, 781-789 (1985).
- Greenspan, P., Mayer, E. P., Fowler, S. D. Nile red: a selective fluorescent stain for intracellular lipid droplets. J Cell Biol. 100, 965-973 (1985).
- Ewald, A. J., Werb, Z., Egeblad, M. Monitoring of vital signs for long-term survival of mice under anesthesia.Cold Spring Harb Protoc. 2011, (2011).
- Tajima, Y., et al. Cerebral hemodynamic response to acute hyperoxia in awake mice. Brain Res. 1557, 155-163 (2014).
- Andermann, M. L., et al. Chronic cellular imaging of entire cortical columns in awake mice using microprisms. Neuron. 80, 900-913 (2013).
- Nimmerjahn, A., Mukamel, E. A., Schnitzer, M. J. Motor behavior activates Bergmann glial networks.Neuron. 62, 400-412 (2009).
- Tsutsui, S., Stys, P. K. Metabolic injury to axons and myelin. Exp Neurol. 246, 26-34 (2013).
- Matute, C., Ransom, B. R. Roles of white matter in central nervous system pathophysiologies. ASN Neuro.4, (2012).
- Matute, C. Calcium dyshomeostasis in white matter pathology. Cell Calcium. 47, 150-157 (2010).
- Stys, P. K., Lipton, S. A. White matter NMDA receptors: an unexpected new therapeutic target. Trends Pharmacol Sci. 28, 561-566 (2007).
- Baltan, S. Surviving anoxia: a tale of two white matter tracts. Crit Rev Neurobiol. 18, 95-103 (2006).
- Stirling, D. P., Stys, P. K. Mechanisms of axonal injury: internodal nanocomplexes and calcium deregulation. Trends Mol Med. 16, 160-170 (2010).
- Wang, H., Fu, Y., Zickmund, P., Shi, R., Cheng, J. X. Coherent anti-stokes Raman scattering imaging of axonal myelin in live spinal tissues. Biophys J. 89, 581-591 (2005).
- Beirowski, B., Nogradi, A., Babetto, E., Garcia-Alias, G., Coleman, M. P. Mechanisms of axonal spheroid formation in central nervous system Wallerian degeneration. J Neuropathol Exp Neurol. 69, 455-472 (2010).
- Shi, R., Asano, T., Vining, N. C., Blight, A. R. Control of membrane sealing in injured mammalian spinal cord axons. J Neurophysiol. 84, 1763-1769 (2000).
- Stirling, D. P., Cummins, K., Wayne Chen,, R, S., Stys, P. Axoplasmic reticulum Ca(2+) release causes secondary degeneration of spinal axons. Ann Neurol. 75, 220-229 (2014).