Nikon Europe B.V. | Europe & Africa
- pt Change Region
- Global Site
novembro 2025
The development of fluorescent probes and microscopy technology have made significant contributions to medicine and biology. They enable real-time observation of the movements of molecules and organelles within living cells, advancing our understanding of cell death pathways and drug mechanisms of action. Furthermore, advances in image processing and analysis technology have enabled label-free cell counting directly from brightfield images. This allows for the simultaneous acquisition of more information, such as cell morphology observation and cell counting, while reducing phototoxicity in live-cell imaging. This application note presents an example of analyzing early apoptosis with low phototoxicity by visualizing mitochondrial membrane potential (MMP) and annexin V using fluorescent probes, and measuring cell numbers using label-free Volume Contrast (VC) imaging. Furthermore, we analyzed differences in cellular response to three drugs: etoposide, staurosporine, and antimycin A.
Keywords: Early apoptosis, Mitochondrial membrane potential, Cell death pathway, Fluorescent probe, Live cell imaging, Volume contrast, Image analysis, Label-free cell counting
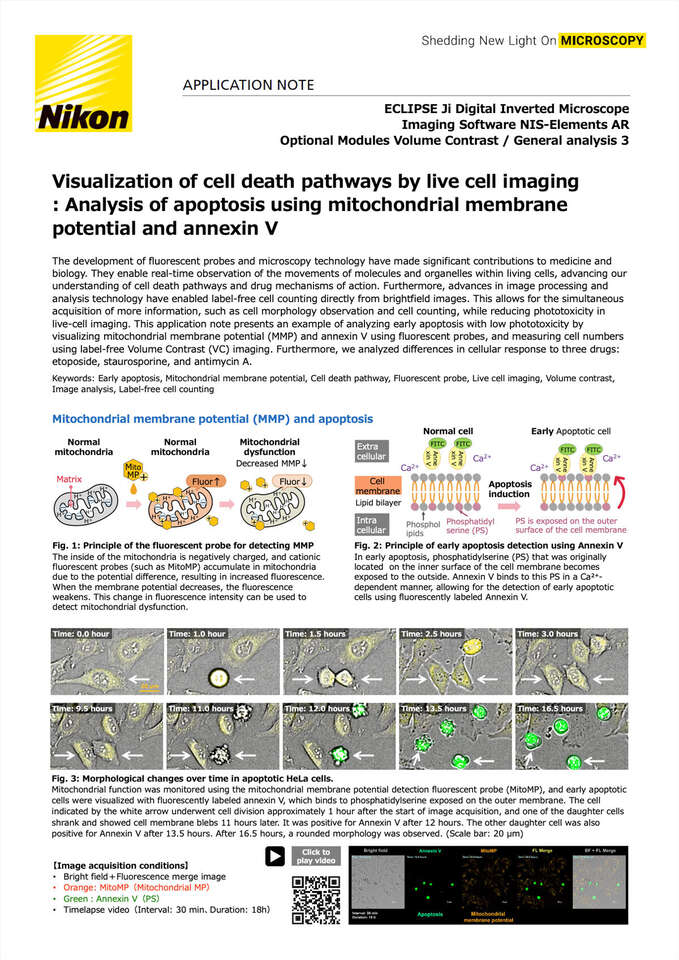
Fig. 1: Principle of the fluorescent probe for detecting MMP
The inside of the mitochondria is negatively charged, and cationic fluorescent probes (such as MitoMP) accumulate in mitochondria due to the potential difference, resulting in increased fluorescence. When the membrane potential decreases, the fluorescence weakens. This change in fluorescence intensity can be used to detect mitochondrial dysfunction.
Fig. 2: Principle of early apoptosis detection using Annexin V
In early apoptosis, phosphatidylserine (PS) that was originally located on the inner surface of the cell membrane becomes exposed to the outside. Annexin V binds to this PS in a Ca²⁺-dependent manner, allowing for the detection of early apoptotic cells using fluorescently labeled Annexin V.
Fig. 3: Morphological changes over time in apoptotic HeLa cells.
Mitochondrial function was monitored using the mitochondrial membrane potential detection fluorescent probe (MitoMP), and early apoptotic cells were visualized with fluorescently labeled annexin V, which binds to phosphatidylserine exposed on the outer membrane. The cell indicated by the white arrow underwent cell division approximately 1 hour after the start of image acquisition, and one of the daughter cells shrank and showed cell membrane blebs 11 hours later. It was positive for Annexin V after 12 hours. The other daughter cell was also positive for Annexin V after 13.5 hours. After 16.5 hours, a rounded morphology was observed. (Scale bar: 20 µm)
【Image acquisition conditions】
Bright field+Fluorescence merge image
Orange: MitoMP(Mitochondrial MP)
Green:Annexin V(PS)
Timelapse video(Interval: 30 min、Duration: 18h)
(1) HeLa cell seeding(1 x 10⁴ cells/well, ibidi 96 well plate), cultured for 24 hours at 37°C in 5% CO₂.
(2) Remove the medium and wash the cells twice with MEM medium.
(3) Add the MT-1 working solution adjusted in MEM medium, and incubate at 37°C for 30 minutes in 5% CO₂.
(4) Remove the supernatant and wash the cells twice with MEM medium.
(5) Cells were treated with various apoptosis inducers adjusted in MEM medium.
(6) Add Annexin V working solution(Dilute Annexin V – FITC stock solution with Quenching Buffer)
For details on staining conditions, please refer to the instruction manuals for MT-1 MitoMP Detection Kit and Annexin V Apoptosis Plate Assay Kit.
7) Place the sample on the stage of the ECLIPSE Ji equipped with a stage-top incubator and acquire time-lapse images at approximately 30-minute intervals for about 18 hours.
(8) After reviewing the time-lapse images, extract 18 hours of data at 2-hour intervals. Quantify the images using the NIS-Elements image analysis module “General Analysis 3 (GA3)”. Display graphs on the viewer to analyze the data. Furthermore, output the analysis data in CSV format and analyze the data using Microsoft Excel®.
|
Detection region |
Fluorescence label |
Ex/Em (nm) |
Exposure time |
|---|---|---|---|
|
MMP |
MT-1 MitoMP |
550/600 |
178 ms (LED Power: 8) |
|
Phosphatidylserine |
Annexin V -FITC |
475/515 |
215 ms (LED Power: 13) |
|
- |
None |
Bright field |
1 ms |
|
Magnification |
Field of view(FOV) |
||
|
10X |
1.77 x 1.77 mm / image |
||
|
# of points |
Z stacks |
||
|
1 Point /well |
6.82 µm x 3 steps (Range:13.64 µm) |
||
Table. 1: Detection regions, fluorescence labels, and image acquisition conditions (Using C-FL-Q Quad band FL filter Cube)
Cell culture | |
|---|---|
Cell Line | HeLa Cell |
Growth medium | MEM |
Culture vessel | Ibidi #89626, µ-Plate 96 Well Square |
Test substances | |
|---|---|
Compound・ | Etoposide (0, 10, 50, 100 µM) Staurosporine (0, 0.5, 5, 10 µM) Antimycin A (0, 1, 5, 10 µM) |
Reagents | ||
|---|---|---|
Product name | Product number | Supplier |
Annexin V Apoptosis Plate Assay Kit | AD12 | Dojindo Laboratories |
MT-1 MitoMP Detection Kit | MT13 | Dojindo Laboratories |
Volume Contrast (VC) is an add-on module for NIS-Elements software that enables the construction of phase distribution images, such as fluorescence images, from bright-field images captured at multiple Z depths. VC images have a high S/N ratio (signal-to-noise ratio), enabling easy distinction of cellular regions from the background. This simplifies segmentation, allowing creation of masks for cell counting and enabling label-free cell number measurement.
GA3 is a versatile image analysis module with excellent data visualization capabilities. In addition to binarization and measurement, it offers robust graph display functions. Fig. 4 shows the “Well Plate View” displayed in the center-right (C-1), providing an overview of the analysis results for the entire well plate. The "GA3 Main" and "GA3 Side" functions enable parallel display of fluorescence intensity change rates for mitochondrial membrane potential (Orange: MitoMP) and apoptosis (Green: Annexin V) in a well plate format (Fig. 4 (C-1)). This allows you to grasp the change rates across the entire plate at a glance without switching screens, allowing you to focus on deeper analysis. GA3's high level of customization supports powerful analyses by providing optimal data display tailored to your experimental content. In addition, analysis results can be exported in Excel format, enabling analysis using your regular statistical analysis software.
Fig. 4: Example of the NIS-Elements GA3 analysis results viewer for mitochondrial membrane potential and early apoptosis
Image with cell count masks overlay (scale bar: 100µm)
(B) Drug dose-response curve
(C-1, C-2, C-3) Well plate format graph display (Stacked Layout). Select the icon within the yellow dotted frame to switch between multiple graphs.
(C-1) Line graph of the change rate in fluorescence intensity in each well (left: MitoMP, right: Annexin V).
(C-2) Left: Drug information for each well (drug name, concentration). Right: Bar graph of the change rate in fluorescence intensity at T=14 h (MitoMP (orange) and Annexin V (blue)).
(C-3) Left: Line graph of the change rate in cell number in each well, Right: Heatmap of the change rate in cell number at T = 14 h.
(D) Left: Data table for all wells; Right: Line graph showing the change rate of fluorescence intensity for MitoMP and Annexin V in the selected image.
(E-I) Enlarged image of the area within the white dotted frame in Image (A)
(E) Brightfield image
(F-H) Fluorescence images (F: MitoMP, G: Annexin V, H: Fluorescence merge image)
(I) Image with cell count mask (pink) overlaid on the brightfield and fluorescence merge image, (Scale bar for E-I: 20 µm).
Antimycin A causes mitochondrial dysfunction, as evidenced by the rapid decline in MitoMP fluorescence intensity within approximately two hours. Since cellular responses to drugs are difficult to predict, automated live-cell imaging proves highly effective. This enables prolonged continuous observation, allowing precise capture of the changes drugs induce in cells, the timing of these responses, and their effects.
Fig. 5: Time-lapse images and analysis results
Image comparing response to three types of drugs:
(A,B,I) Etoposide 100 µM
(C,D,J) Staurosporine 10 µM
(E,F,K) Antimycin A 10 µM
(G,H,L) Control (untreated)
(A,C,E,G) Bright field image
(B,D,F,H,I-L) Fluorescence merge image (Orange: MitoMP, Green: Annexin V)
(A-H) Upper row: T=0h, Lower row: T=18h
(I-L) Image at T=18h
Scale bar: (A-H) 20 µm, (I-L) 100 µm.
Graph: Time series line chart
Upper row: Cell count rate of change
Middle row: MitoMP mean fluorescence intensity rate of change
Bottom row: Annexin V mean fluorescence intensity rate of change
(M) Etoposide
(N) Staurosporine
(O) Antimycin A
The three drugs showed characteristic response patterns in HeLa cells. Etoposide induced apoptosis at high concentrations, but the effect was relatively mild, whereas staurosporine was a potent drug that rapidly induced apoptosis even at low concentrations (Fig. 5 (M, N, Bottom row)). Antimycin A caused the most significant mitochondrial dysfunction (Fig. 5 (O, Middle row)).Etoposide (100 µM) induced apoptosis, with Annexin V fluorescence intensity gradually increasing 12 hours after treatment (Fig. 5(M)). Staurosporine (10 µM) immediately caused the cells to shrink, and morphological changes were already observed at the start of imaging (T=0) (Fig. 5(C, Upper row)). Antimycin A (10 µM) caused an immediate decrease in MitoMP fluorescence intensity, with a reduction in mitochondrial membrane potential already observed at the start of imaging (Fig. 5(F, Upper row)). Furthermore, a loss of mitochondrial membrane potential (ΔΨm) was confirmed within 2 hours of treatment with Antimycin A (10 µM) (Fig. 5(O, Middle row)). Typically, mitochondrial dysfunction causes cell death or growth inhibition, but in this short-term observation (18 hours), the cell count increased by approximately 1.3 times. This is thought to be due to a metabolic shift involving the Warburg effect.
Therefore, in this experiment, although Antimycin A treatment reduced the mitochondrial membrane potential, HeLa cells were able to continue supplying the energy required for cell proliferation over the short period of 18 hours by enhancing glycolysis. However, long-term Antimycin A treatment ultimately induces cell death (apoptosis or necrosis) and reduces cell numbers, as reported in numerous studies.
Table. 2: Comparison of the change rate (Relative to Initial Values) and drug response after 18 hours at high concentrations of each drug
This experiment focused on early apoptosis, and data were acquired through 18-hour time-lapse imaging. Even during this 18-hour imaging period, the fluorescent probe MitoMP (MT-1) showed minimal fluorescence intensity decrease of only 10% in the control wells, demonstrating very low photobleaching and yielding highly accurate results. When analyzing later stages of cell death, such as late apoptosis or necrosis, co-staining with a dead cell detection fluorescent probe (PI: propidium iodide) and extending the observation time enables analysis. Furthermore, combining these with ROS (reactive oxygen species) detection probes enables a more detailed elucidation of the mechanisms underlying cell death pathways. Advances in fluorescent probes and microscopy technology are making significant contributions to the further development of medicine, pharmacology, and biology.
Product name | Product number | Supplier |
|---|---|---|
-Cellstain®- PI solution | P378 | Dojindo Laboratories |
ROS Assay Kit -Highly Sensitive DCFH-DA- | R252 | Dojindo Laboratories |
Experimental cooperation and sample provision :
Dojindo Laboratories, Co. Ltd.
We would like to express our sincere gratitude to Ms. Yasuka Komatsu of Dojindo Laboratories, Co. Ltd and all involved parties for their assistance in establishing the experimental conditions for apoptosis induction and the optimized staining protocol for imaging.
Chiharu Kobayashi
Nikon Corporation, Tokyo, Japan
ECLIPSE Ji Digital Inverted Microscope
ECLIPSE Ji enables a high flexibility in experiments when used in combination with NIS-Elements AR. Flexible customization allows you to optimize your experiments to suit your individual needs. Additionally, installing a stage-top incubator enables live cell imaging using time-lapse image acquisition.
Imaging software NIS-Elements AR
NIS-Elements AR's HCA/JOBS (Bundle JOBS) provides complete solutions for high content imaging. Streamline your experiments with a seamless workflow from image acquisition to analysis.
General Analysis 3, image analysis module
GA3 is a tool that automates and streamlines image analysis. It allows you to visually build analysis flows using nodes (analysis blocks), automating everything from image processing to data analysis. A variety of functions, including image processing, segmentation, measurement, graph display, and NIS.ai, can be flexibly combined to display data in the most optimal format for your experiment, providing powerful support for analysis.


