構造化照明顕微鏡法による、ラット海馬初代神経細胞の樹状突起スパインのイメージング
Abstract
Dendritic spines are protrusions emerging from the dendrite of a neuron and represent the primary postsynaptic targets of excitatory inputs in the brain. Technological advances have identified these structures as key elements in neuron connectivity and synaptic plasticity. The quantitative analysis of spine morphology using light microscopy remains an essential problem due to technical limitations associated with light's intrinsic refraction limit. Dendritic spines can be readily identified by confocal laser-scanning fluorescence microscopy. However, measuring subtle changes in the shape and size of spines is difficult because spine dimensions other than length are usually smaller than conventional optical resolution fixed by light microscopy's theoretical resolution limit of 200 nm.
Several recently developed super resolution techniques have been used to image cellular structures smaller than the 200 nm, including dendritic spines. These techniques are based on classical far-field operations and therefore allow the use of existing sample preparation methods and to image beyond the surface of a specimen. Described here is a working protocol to apply super resolution structured illumination microscopy (SIM) to the imaging of dendritic spines in primary hippocampal neuron cultures. Possible applications of SIM overlap with those of confocal microscopy. However, the two techniques present different applicability. SIM offers higher effective lateral resolution, while confocal microscopy, due to the usage of a physical pinhole, achieves resolution improvement at the expense of removal of out of focus light. In this protocol, primary neurons are cultured on glass coverslips using a standard protocol, transfected with DNA plasmids encoding fluorescent proteins and imaged using SIM. The whole protocol described herein takes approximately 2 weeks, because dendritic spines are imaged after 16-17 days in vitro, when dendritic development is optimal. After completion of the protocol, dendritic spines can be reconstructed in 3D from series of SIM image stacks using specialized software.
Introduction
A dendritic spine is a small protrusion of the neuron membrane. This characteristic structure is specialized to typically receive input from a single synapse and represents the physical contact area between two neurons. Most functionally mature dendritic spines consist of a globular tip, termed head, and a thin neck that connects the head to the dendritic shaft. However, spines are not static and actively move and change their morphology continuously even in the adult brain 2. Within a 2 week period of time, rat primary hippocampal neuron cultures derived from late embryonic or early postnatal time develop complex dendritic arbors with numerous membrane protrusions that evolve from early filipodia to spine-like structures 3. Based on this dynamic behavior and other characteristics, dendritic spines are thought to provide an anatomical substrate for memory storage and synaptic transmission 4,5.
Given the critical role that dendritic spine size and shape have in synaptic function, it is important to measure their dimensions accurately. Spines vary from around 200 to 2,000 nanometers in length and can be readily identified by confocal laser-scanning fluorescence microscopy. However, spine dimensions other than length are usually below the conventional optical systems' resolution, theoretically fixed by diffraction around 200 nanometers 6. These resolving powers are insufficient for imaging finer details, such as the width of spine necks and heads. Much work has been dedicated to solve this problem and many relatively new super-resolution microscopy techniques have provided substantial progress. In particular, it is possible to achieve resolution beyond the classical limit without discarding any emission light by using laterally structured illumination microscopy (SIM) in a wide-field, non-confocal microscope 7-10. Using this technique in combination with non-linear microscopy techniques, it is theoretically possible to improve the lateral resolution of the optical microscope by an unlimited factor 11. However, in most experimental circumstances, SIM allows to surpass the resolution limit by a factor of two 1. Other super-resolution optical microscopy techniques such as Stimulated emission depletion (STED) microscopy 12 and photo-activation localization microscopy (PALM) 12 have been applied to imaging of dendritic spines. Localization-based methods such as PALM require very large numbers of raw images to achieve super-resolution and are therefore limited in speed. On the other hand, STED can achieve high imaging speed, although at relatively low photon counts and small fields of view, which may not be the case for SIM 13.
In this article the aim is to provide a working protocol to image dendritic spines from rat primary hippocampal neurons cultured in vitro using SIM. The protocol consists of two distinguishable phases: an initial one consisting of establishment, development, transfection and immunohistochemistry of rat primary hippocampal neuron cultures and a late phase dedicated to sample imaging.
Protocol
All experimental procedures involving animals were optimized to reduce animal suffering and were approved by the Commission for Animal Experimentation, University of Amsterdam, DEC protocol # DED204 and DED250.
1. Coverslip Preparation
- Cut down the coverslips to a size of 15 mm x 15 mm using a carbide or diamond scribe, so that they fit into the wells of a 12-well plate.
- While working in a fume hood, start coverslip coating by fully submerging coverslips in concentrated nitric acid solution (70% wt/wt) in a glass container. To ensure even distribution shake, then incubate for a minimum of 4 hr. It is possible to reuse the concentrated nitric acid solution for approximately 2 times, but it can loose color by exposure to light.
- Remove the concentrated nitric acid solution and wash the coverslips four times in distilled water for 30 min, carefully shaking after each wash.
- With caution remove the water.
Note: the next three steps are performed in a sterile laminar flow cabinet. - Soak the coverslips in 96% EtOH. Remove the coverslips from the EtOH solution and let them dry.
- Flame the coverslips and put them in a glass container. Use fine forceps to handle the coverslips (Dumont style no.5 forceps for example).
- Cover the container with aluminum foil and bake in a dry-heat oven for 12-16 hr at 180 °C. Baked coverslips can be stored at room temperature for up to 1 month if covered tightly.
2. Coverslip Coating
The coverslip coating procedure favors neuron attachment to the glass surface and dendritic arborization 14.
- In a sterile laminar hood, use sterile small forceps to place the individual coverslips in single wells of a 12-well plate.
- Add 500 μl of Poly-L-lysine solution (or sufficient amounts to submerge the coverslips).
- Wrap the plate in aluminum foil to prevent evaporation and leave it overnight at room temperature.
- Before starting the culture, aspirate the Poly-L-lysine solution carefully in a sterile laminar hood.
- Wash each well with 1 ml of sterile water twice, whilst preventing them to dry out.
- Aspirate water completely, add 1 ml of plating medium and leave the coverslips in the tissue culture incubator until ready to plate the cells. It is recommended to plate the cells within 24 hr.
3. Removal of Brains from E16-E19 Rat Embryos
- Sterilize the surgical instruments by heating them in a dry sterilizer overnight or washing them with 70% EtOH. Dry thoroughly if EtOH is used.
- Prepare several 30 mm dishes with 1x HBSS buffer and keep them on ice.
- Euthanize the rat dam with an intraperitoneal injection of Euthasol (160 mg/kg Euthasol in a volume of ± 0.4 ml).
- Check for the absence of reflexes.
- Spray the dam's abdomen with 70% EtOH.
- Make an incision along the abdomen and remove the uterus.
- Remove the embryos from the uterus and place them in a 100 mm diameter petri dish.
- Remove the heads of the embryos with large scissors and place the heads in a new petri dish containing cold 1x HBSS buffer.
Note: from here to step 7.1 the procedure is performed under sterile conditions in a laminar flow cabinet. - Hold down the heads along the sides with big forceps.
- With small scissors, make a sagittal cut in the skin on top of the head, then laterally peel the skin down with a large forceps.
- Use the same approach as in step 3.10 to remove the skull. Make a sagittal cut starting at the caudal end; gently opening the skull without damaging the brain tissue. Fold the two halves of the skull away laterally exposing the brain.
- With the blunt spatula, scoop out the brain and place it in fresh cold 1x HBSS.
4. Dissection of the Hippocampi
It is very important that the dissection is done as quickly as possible in sterile conditions to ensure cell viability Keep the samples cold on ice.
- Remove and discard the cerebellum with the fine scissors.
- Separate the two hemispheres of the brain by making a sagittal cut along the midline.
- Take each hemisphere and place both in a new 30 mm dish containing fresh cold 1x HBSS.
- Place each hemisphere such that the temporal lobe faces the bottom of the dish.
NOTE: From here on, it is recommended to use a dissecting microscope. - Gently hold the midbrain using a small forceps and remove the midbrain with another pair of forceps. Leave the remainder of the hemisphere intact containing the cortex and the hippocampus.
- Turn over the tissue, so that the hippocampus is now facing the bottom of the dish.
- Gently hold the hemisphere in place with a fine forceps. By using another fine forceps, carefully and gently remove the meninges. It is easier to start at the olfactory bulb. Use caution so as not to damage the hippocampus.
- Orient the tissue so that the hippocampus is now facing up. The hippocampus can now be seen by its characteristic C-shaped structure.
- By using fine forceps, dissect out the hippocampus. Collect it in a new 30 mm dish containing fresh cold 1x HBSS.
5. Cell Dissociation and Plating
- Count the total number of hippocampi, then cut them into small pieces.
- Collect the pieces in a 15 ml centrifuge tube containing 3 ml 1x HBSS.
- Centrifuge at 300 x g for 5 min and carefully remove the supernatant.
- Add 6 μl Trypsin per hippocampus.
- Incubate for max 20 min at 37 °C. Swirl after 3 min.
- Wash two times with 5 ml of fresh cold 1x HBSS and discard the supernatant.
- After the second wash, add 1.5 ml of plating medium, pre-warmed to 37 °C. The serum in the plating medium will inactivate Trypsin activity.
- Slowly triturate 30x with a fire-polished Pasteur pipette until all pieces of tissue are homogenously dispersed into single cells. Avoid any bubbling.
- Add 5 ml of plating medium pre-warmed to 37 °C.
- Count cells using a Trypan blue vital staining.
- Seed 50,000 cells per well of a 12-well plate in 1 ml plating medium, prepared in Section 2 (total volume 2 ml).
- Gently rock the plate to evenly distribute the cells.
- Incubate at 37 °C, 5% CO2. After 2-3 days, replace half of the plating medium (0.5 ml) with culture medium containing 10 µM FUDR.
Note: Dendritic spine imaging is performed 16-17 days after plating (16-17 days in vitro, DIV).
6. Rat Hippocampal Primary Neuron Transfection using Lipofectamine
On DIV 14-15 neurons are transfected using the following protocol:
- Prepare plasmid DNA expressing GFP and incubation medium (10 ml of Neurobasal medium with 100 μl of glutamax).
- Pre-warm the incubation medium to 37 °C.
- Prepare DNA mix (Tube A). For each coverslip add 1 μg of DNA in 100 μl of plain Neurobasal medium. Gently mix.
- Prepare Lipofectamine mix (Tube B). For each coverslip add 2 μl Lipofectamine in 100 μl of plain Neurobasal medium. Gently mix.
- Add the Lipofectamine mix to the DNA mix dropwise.
- Incubate in the laminar flow hood for 30 min at room temperature.
- Add 1 ml of pre-warmed incubation medium to plate 1.
- Store plate 2 for 5 min at 37 °C, 5% CO2.
- Gently add dropwise 200 μl of the DNA/Lipofectamine mix to each well and incubate for 45 min at 37 °C, 5% CO2.
- With the use of small forceps lift the coverslips containing the neurons and rinse them by dipping them in a 3 cm dish containing fresh warm Neurobasal medium and move them to plate 2.
- Incubate the transfected neurons at 37 °C, 5% CO2 for 48 hr.
- Check for transfection efficiency 24 hr after transfection.
7. Immunostaining and Mounting of Rat Hippocampal Primary Neurons
To improve fluorescence intensity in transfected cells, perform an immunostaining protocol to enhance GFP detection 48 hr after transfection.
- Prepare 4% PFA and 0.05 M TBS.
- Warm the 4% PFA solution to 37 °C.
- Gently aspirate the medium from the wells containing the coverslips.
- Add 500 μl of warm 4% PFA carefully to prevent damaging the dendrites.
- Incubate at room temperature for 15 min.
- Wash with 1x HBSS 3 times for 5 min.
NOTE: at this point samples could be stored up to 3 weeks at 4 °C or immunostaining can be started immediately. - If samples were stored, wash with 0.05 M TBS 3 times for 5 min.
- Block with TBS-BSA (1%) solution at room temperature for 30 min.
- Wash with 0.05 M TBS 3 times for 5 min.
- Add the primary antibody diluted in incubation mix.
- Incubate the plates for 1 hr at room temperature.
- Further, Incubate overnight at 4 °C with gentle shaking.
- Remove the primary antibody.
- Wash with 0.05 M TBS 3x for 5 min.
NOTE: from this point on, keep the coverslips protected from light. - Add the secondary fluorescent-conjugated antibody diluted in incubation mix.
- Incubate at room temperature for 2 hr.
- Remove the secondary antibody.
- Wash with 0.05 M TBS 3 times for 5 min.
- Wash with 1X TB 2 times for 5 min.
- Use fine tweezers to remove to coverslips from the wells.
- Dry any excess of TB with a tissue and mount the coverslips using mounting medium.
- Seal with nail polish to prevent evaporation of mounting medium.
8. Dendritic Spine Imaging using Structure Illumination Microscopy
Dendritic spine imaging using the SIM system described in the materials has a lateral resolution (XY) value of approximately 85-110 nm and an axial (Z) resolution value between 200 - 250 nm, providing a factor of 2 times improvement in resolution compared to wide-field microscopy.
NOTE: Dendritic spine imaging using SIM is done typically 2 days after step 7.22, but could be done up to 3 weeks later if samples are kept in the dark and under a controlled temperature of 22 - 23 °C.
- Turn on the 488 nm laser, the mercury lamp, the stage controller, the piezo controller, the halogen lamp for transmitted light and the PC and start up the SIM software in the "ANDOR for N-SIM" mode.
- Clean the 100x TIRF objective with 95% ethanol three times, and if necessary with petroleum ether.
- Use the following filter settings: 520 LP with a 488 dichroic.
- Put a drop of immersion oil on the objective. Check that there are no air-bubbles in the oil-drop. Move the objective upwards until the oil touches the sample.
Note: Place a cover over the stage to protect the sample from ambient light and dim the lights in the room as much as possible. - Set the correction collar of the objective to 37 °C, 200 µm, to obtain the best symmetry of PSF. In order to set the correct collar position, first position the objective ring at the optimal nominal position and then check a 100 nm bead sample. According to the best PSF's symmetry, slightly change the collar position around the nominal one.
- For illumination, use 3D-SIM grating (3D 1layer 100X/1.49 all wavelengths). To begin the grating alignment place the selected grating block into the SIM illuminator, with the 100X 1.49 objective in place. Use a 100 nm bead sample mounted in media, with a concentration that can allow isolating 10-15 beads for a field of view (FOV). After setting the objective correction collar to the desired position, select the 3D-SIM illumination and start the software-guided alignment procedure. It will run (5 phases) x (1 direction) x (100 z-planes) images, from which it will reconstruct the FOV with beads. After selecting a single bead via an appropriate ROI, covering the entire bead including the out-of-focus blurred light, the software will start an automatic PSF fitting and it will adjust the grating position according to the result.
- To check the performance of the microscope, repeat the grating alignment every 2 weeks, because of the possible misalignment caused by table movements and/or temperature drifting. Furthermore, also check the laser intensity and stability according to the manufacturer's suggestions.
- Clean the sample surface with 95% ethanol three times.
Note: For the next steps see figure 3 for an overview of the control panels and the correct settings within the SIM software. - In the SIM software, select the Optical Configuration Eye FITC and select an empty filter block in Turret 1 for visual inspection with white light.
- Set the focusing speed and the travel speed of the XY table to "Fine".
- Open the shutter and quickly focus on the sample.
- Close the shutter again and set the Z-coordinate to zero.
- Select the green filter in Turret 1 for visual inspection using the green channel.
- Set the intensity of the mercury lamp to the lowest setting.
- Move to the border of the sample carefully, making sure that the objective does not touch the sealant.
- Open the shutter and quickly scan through the sample with the lowest possible intensity.
- Upon encountering a sufficiently bright dendrite of interest and centering a segment of interest in the field of view, close the shutter.
- Set the software to Optical Configuration 3D-SIM 488 and the camera settings to read-out mode EM, gain 1 MHz 16-bit, exposure time 100 msec, laser power 5% and EM gain 200.
NOTE: Check that the green filter in Turret 2 is selected and that Turret 1 is empty. - Check that the grating is set to ‘Moving' and click Live to view the sample with laser light and through the camera.
- Activate the Look Up Table.
- Center the object of interest if necessary and focus with the focusing speed set to Extra Fine.
NOTE: in the read-out mode EM gain 1 MHz 16-bit, the target intensity for a good SIM image is between 30,000-45,000. - Quickly adjust the camera settings to get an intensity value between 30,000-45,000 in the read-out mode EM gain 1 MHz 16-bit. Initially use:
- Laser power: 0% - 20% (with samples prepared as described above, 5% or 2.6 mW is sufficient)
- Exposure time: 50 msec-2 sec
- Read-out mode: EM gain 1 MHz 16-bit
- EM gain: 0-300
- Conversion gain: 1x - 5.1x
- Format for Live: No binning
- Format for Capture: No binning
NOTE: with these settings 6.3% ± 1.3% bleaching is routinely achieved, within a 10% limit of acceptable maximum bleaching, which could significantly affect the image quality 15.
- Click Stop to turn off Live view.
- Configure the settings of the 3D Z stack in the ND Sequence panel to:
- Range: 2 µm
- Set size: 120 nm
- Z plane
- Click Home position
- Select the Optical Configuration 3D-SIM 488 in the Lambda section
- Select 3D-SIM as the acquisition mode in the N-SIM pad.
- Run the ND Sequence acquisition and save the raw data.
- Select the Optical Configuration Eye FITC again and repeat steps 8.15-8.27 until the entire sample has been imaged
- 3D Image reconstruction: The data acquired in step 8.23 can either be reconstructed right away or later on. Start by reconstructing the Z stack with the default reconstruction settings in Reconstruct Slice or Reconstruct Stack mode and adjust if necessary.
NOTE: for best results, Z stacks should be made with the indicated step size and reconstructed in Reconstruct Stack mode. Always check the validity of the reconstructed image by comparing it to the raw data or, preferably, a wide-field image. The parameters that can be adjusted for the reconstruction process are the contrast and high frequency noise suppression. Both of them influence how different raw image properties are taken into account during the reconstruction process. In case of low modulation depth raw data, the contrast parameter plays an important role. If the user has datasets with a low signal-to-noise ratio, then the high frequency noise suppression parameter can influence the reconstruction quality severely. - When imaging in finished, center the XY stage and move the objective all the way down to its resting position.
- Unmount the sample and clean both the sample and objective with 95% ethanol.
- Shut down the software and the PC and switch off all other devices.
- 3d reconstruction and spine classification of the acquired images can be carried out after converting the files to TIFF as described before using NeuronStudio software (see Figure 4) 16.
- Use the following parameters for reconstruction in the NeuronStudios software:
- Volume: Voxel dimensions: X: 0.03 μm; Y: 0.03 μm; Z: 0.120 μm.
- Dendrite detection: Attach ratio: 1.3; Minimum length: 5 μm; Discretization Ratio: 1; Realign junctions: Yes.
- Spine detection: Minimum height: 0.2 μm; Maximum height: 5.001 μm; Maximum width: 3 μm; Minimum stubby size: 10 voxels; Minimum non-stubby size: 5 voxels.
- Spine Classifier: Neck ratio (head-neck ratio): 1.1; Thin ratio: 2.5; Mushroom size: 0.35 μm;
- NeuronStudio parameters used for rendering: Neurite vertex shape: solid eclipse; Neurite vertex color: by type; Neurite edge shape: line; Neurite edge color: single color; Spine shape: solid eclipse; Spine color: by type.
Note: After 3D reconstruction is it also possible to set the volume render. The default threshold was set to 20 with the 'Regenerate volume rendering' option active. Opacity was set by 'Automatic Intensity' checked. 'Surface only' and 'Use Point Pre-Rendering' options were also active
Representative Results
Described here is a standardized working protocol for imaging dendritic spines from rat primary hippocampal neurons in vitro using SIM. The protocol workflow and its crucial steps are shown in Figure 1. Overall, the protocol takes approximately 2 weeks of experimental work separated in a first phase of sample preparation, including culture, development and transfection of rat primary hippocampal neurons and immunohistochemistry, and second phase of sample imaging using SIM. The rat primary hippocampal neurons are fixed approximately 2 weeks after start of the culture, when neurons have developed complex dendritic arbors bearing numerous dendritic spines 3,5. Using the protocol described in detail in sections 1-8, it is possible to systematically image dendritic spines with super resolution. In comparison with a conventional dendritic spine imaging method using confocal fluorescence microscopy that is described before 16,17, the protocol described herein using SIM provides significantly better image resolution and 3D reconstruction, allowing the identification and classification of neuron membrane protrusions ranging from early filipodia to spine-like structures.
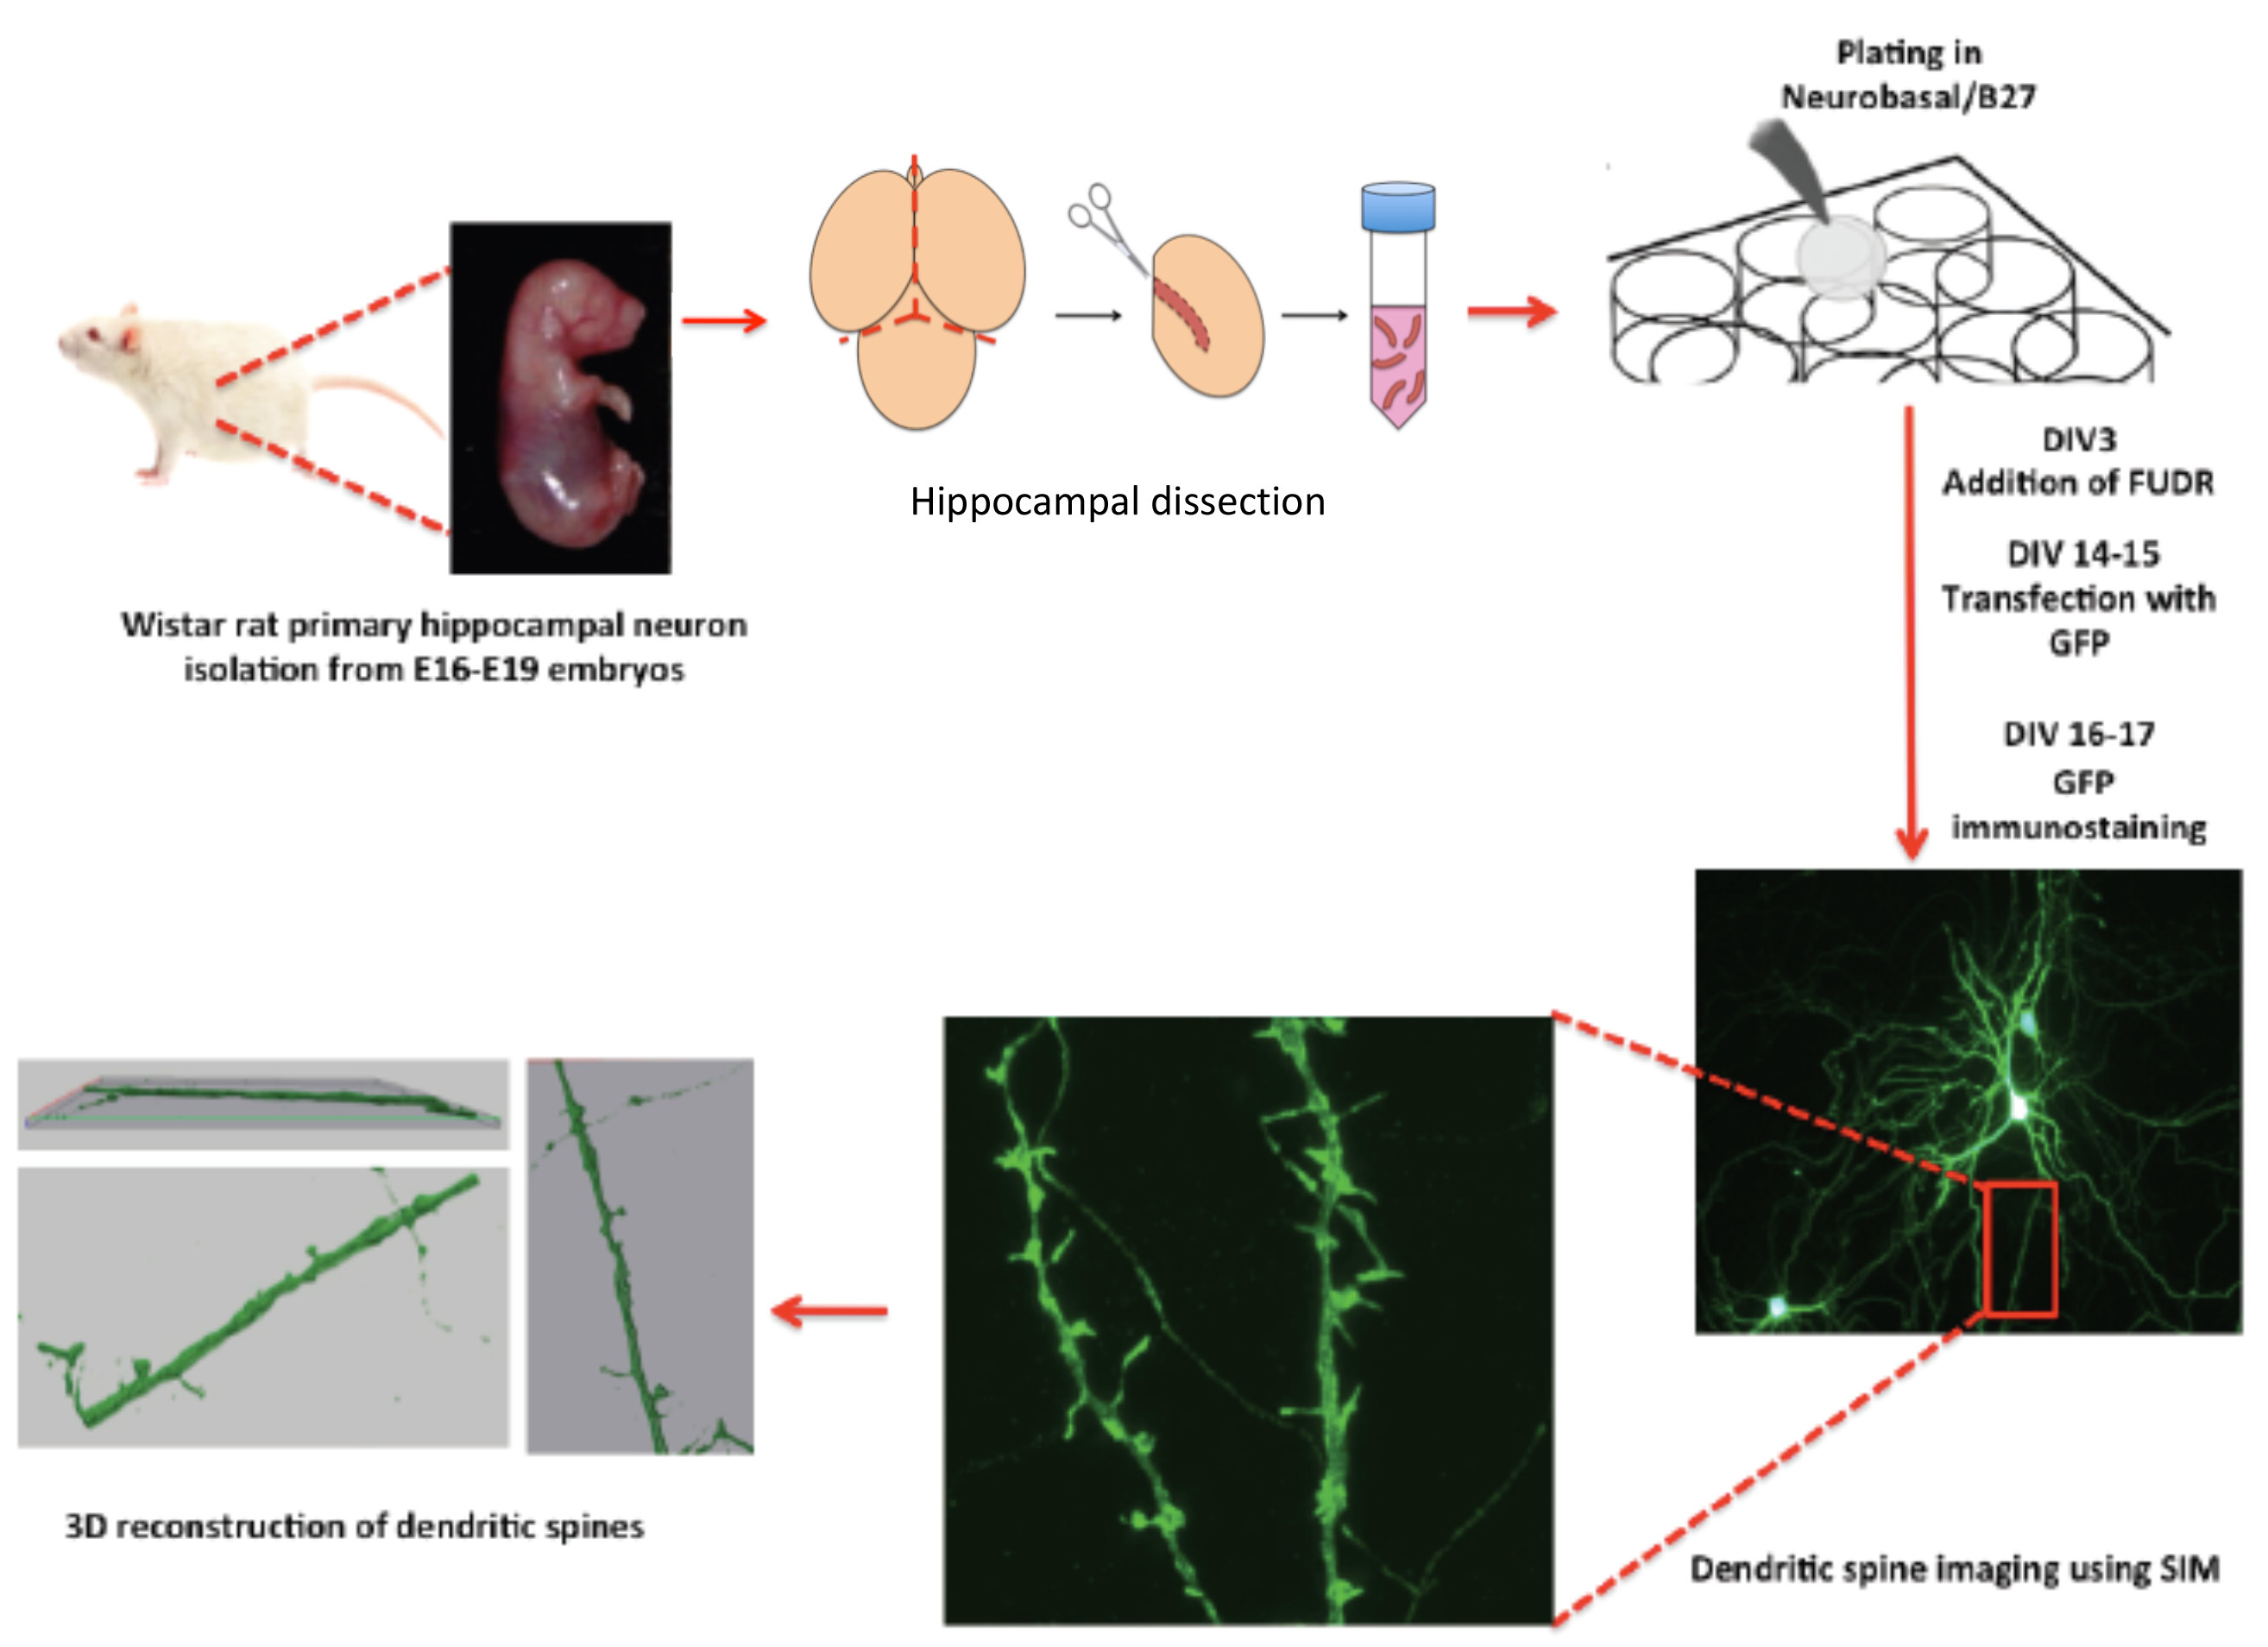
Figure 1. The scheme shows a protocol workflow, its steps and timing.
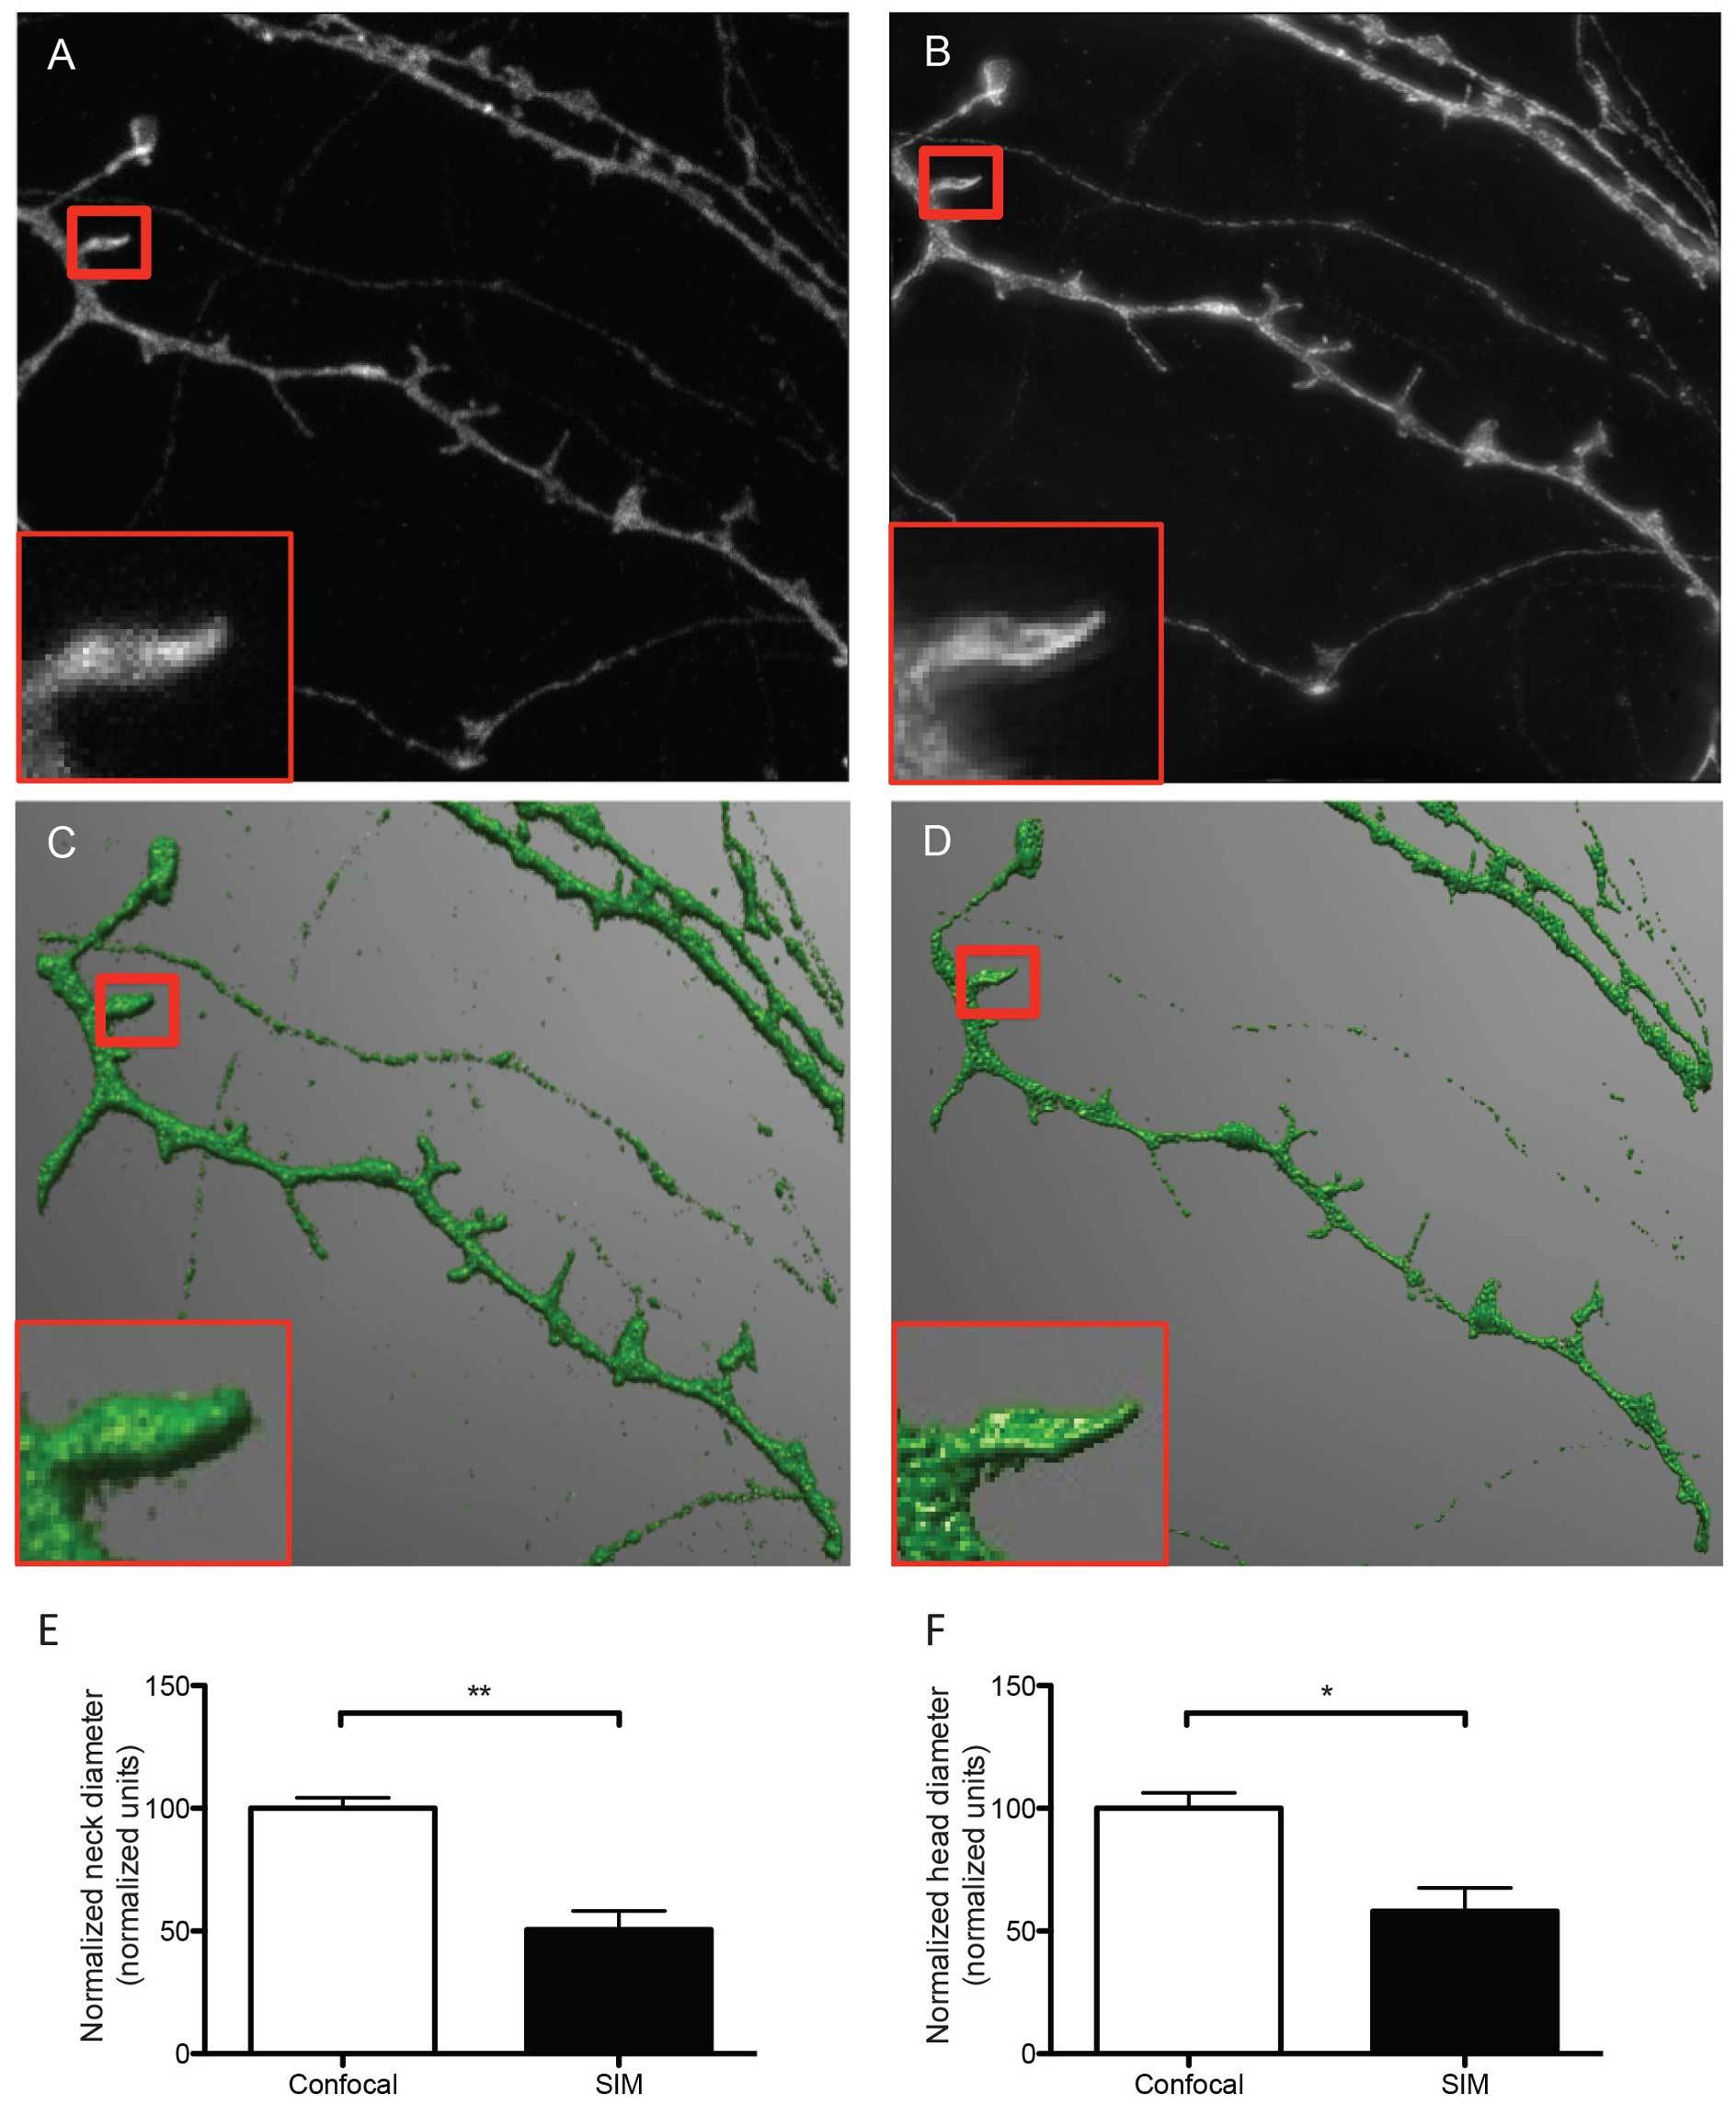
Figure 2. Representative micrographs of dendrites and dendritic spines imaged with confocal (A) and SIM microscopy (B). The representative SIM micrograph was acquired as described in section 8, the representative confocal micrograph was acquired using physical pinhole size: 30 μm laser power 2.6 mW, no averaging. Acquisitions were reconstructed from confocal and SIM images (C and D, respectively) using NeuronStudio software as described before 16. Dendrites were traced and spines were classified automatically with the software after adjusting main parameters such as neck length, neck diameter and head diameter. The boxed areas show one individual dendritic spine imaged with confocal (A) and SIM (B) and reconstructed from their corresponding Z stacks (C and D), depicting differences in resolution and accuracy of the resulting 3D reconstructions. According to SIM's higher resolution, quantitative analysis of both head (E) and neck (F)diameter reveals that SIM measures significantly smaller dimensions than confocal microscopy for the same dendritic spines, indicating that SIM is capable of detecting smaller changes in dendritic spine morphology. Data in E and F are normalized to the reference confocal measurements. Results are presented as mean ± SD of 3 dendritic spines extracted from 5 dendritic segments imaged in both confocal and SIM microscope modes. For neck diameter there was a significant difference (** p = 0.0049) between confocal (100.0 ± 4.296 normalized units) and SIM (50.61 ± 7.642 normalized units) images, as tested with a Students t-test (E). For head diameter there was a significant difference (* p = 0.0209) between confocal (100.0 ± 6.255 normalized units) and SIM (58.12 ± 9.451 normalized units) images, as tested with a Students t-test.
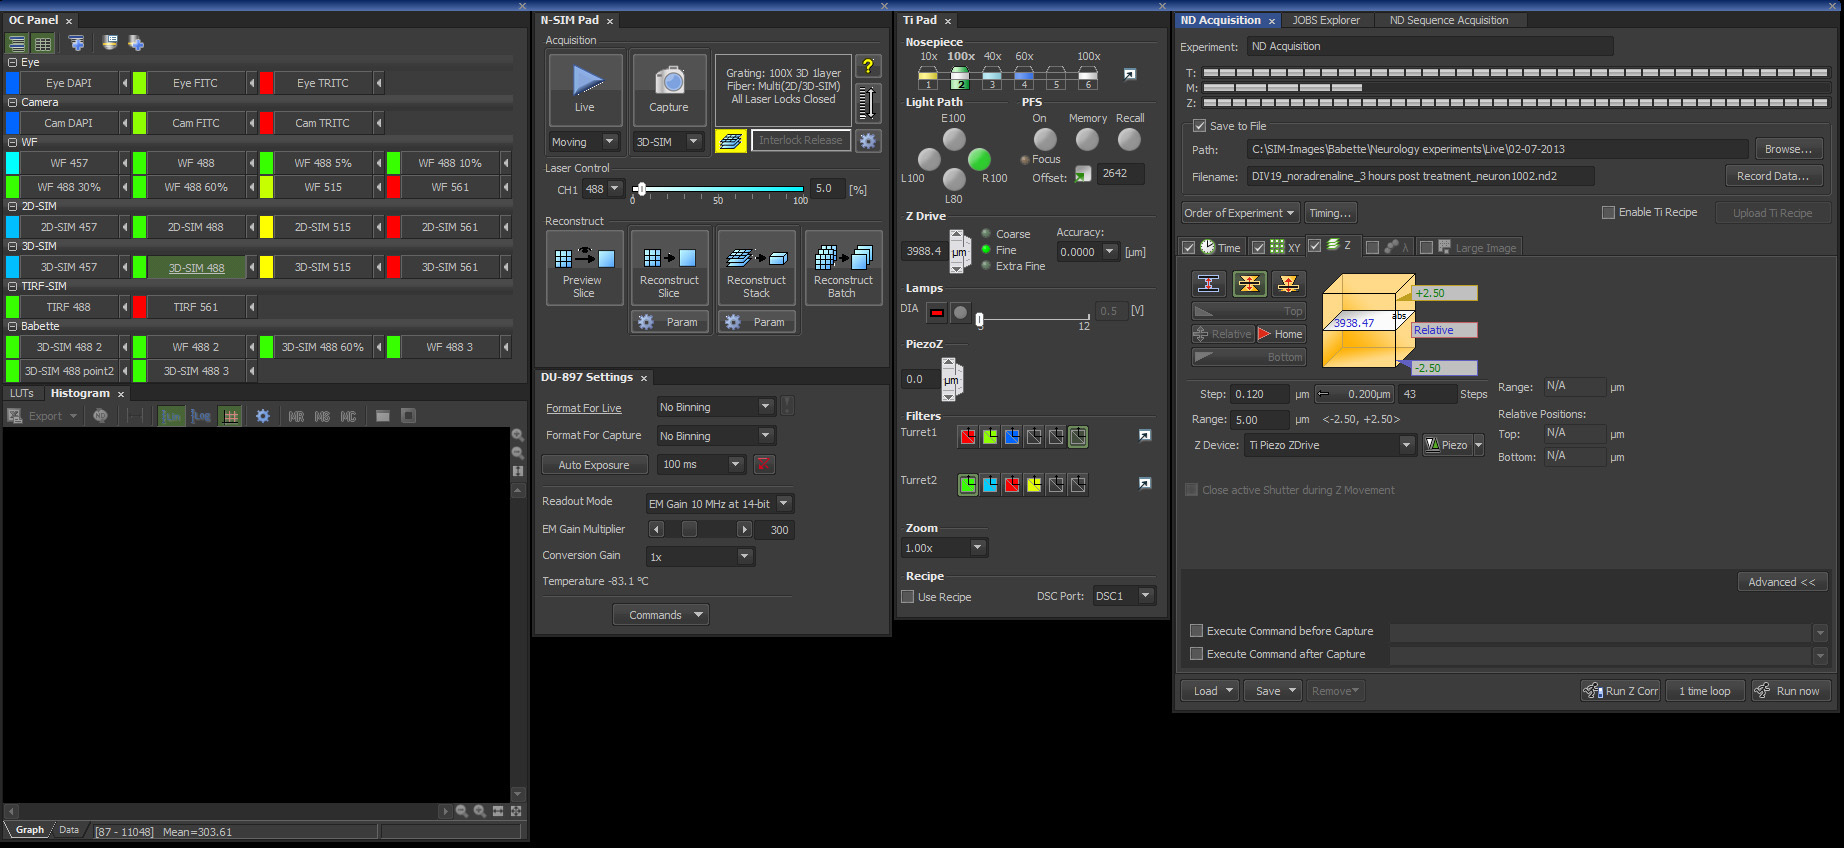
Figure 3. Screenshot from the Nikon's NIS-Elements 6.14 SIM software package with the settings described in this protocol.
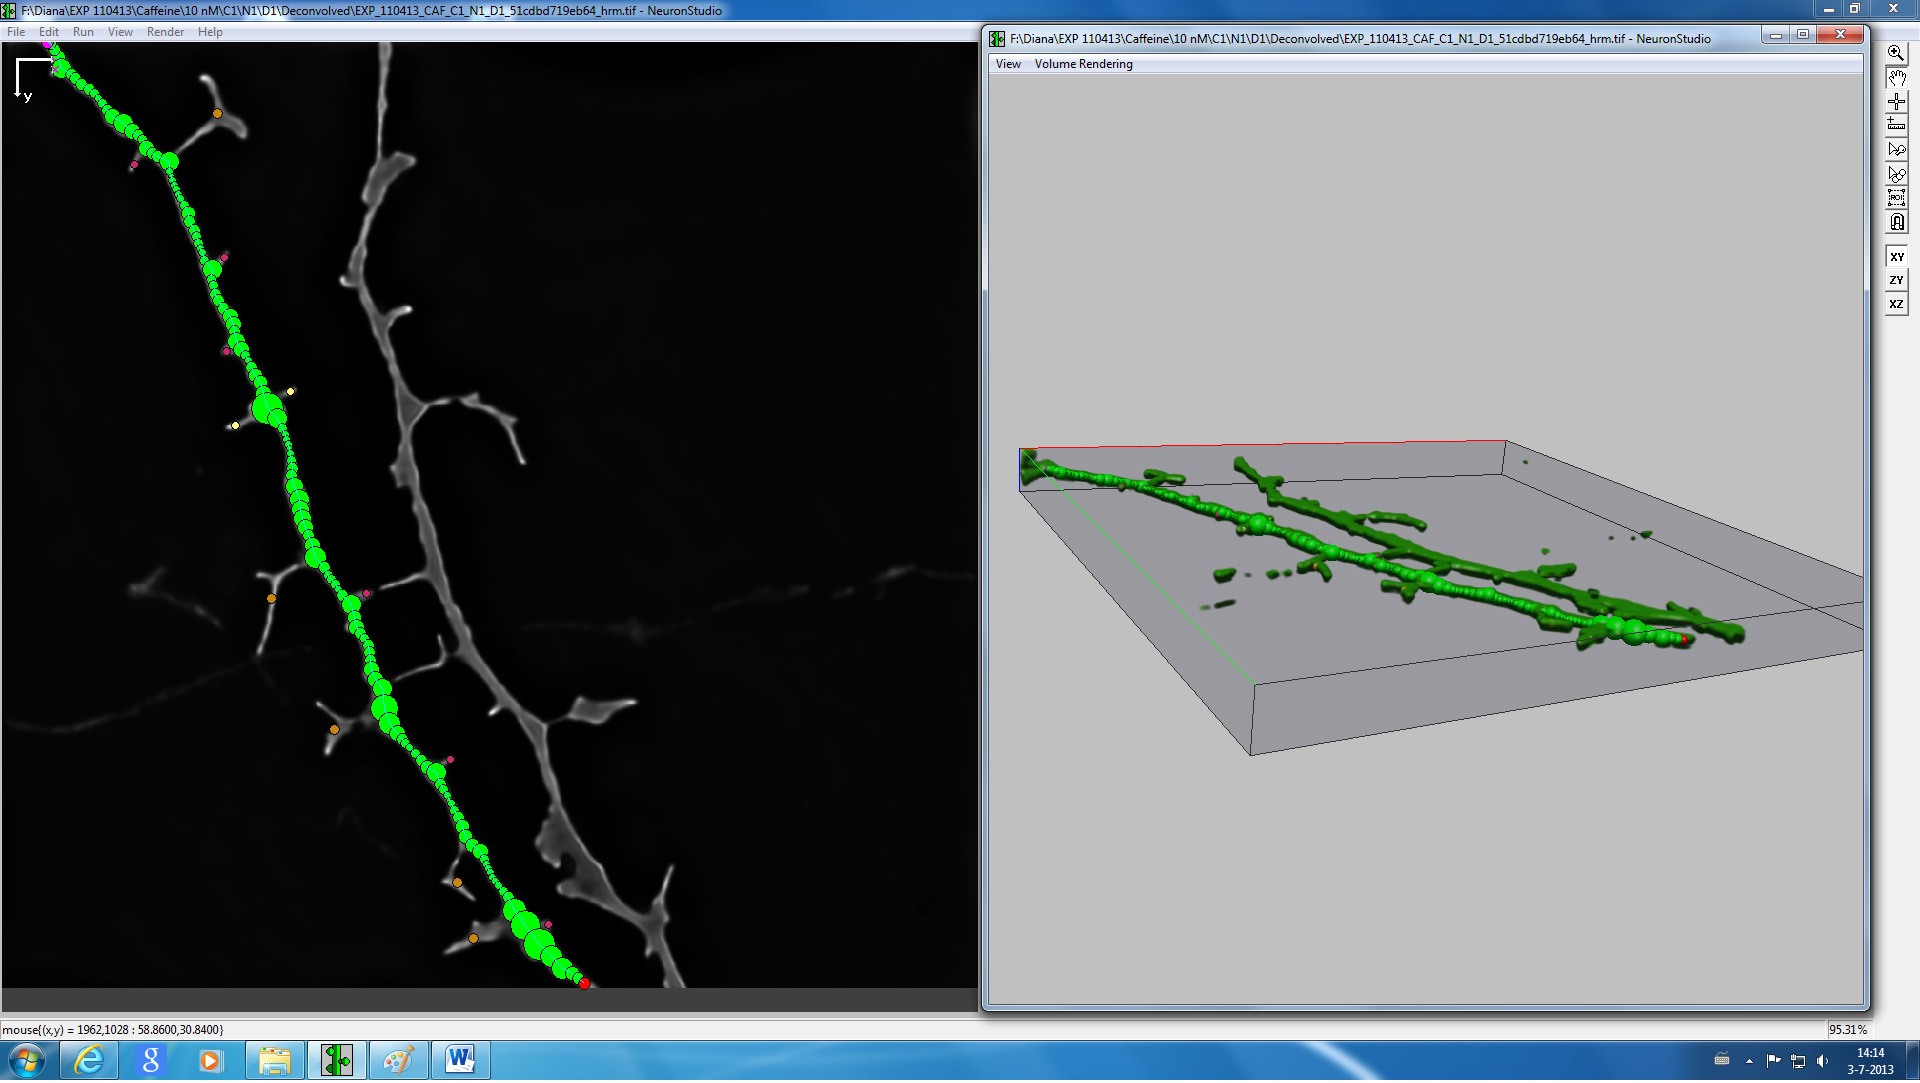
Figure 4. Screenshot from NeuronStudio 3D reconstruction and spine classification software of a representative image of a dendrite.
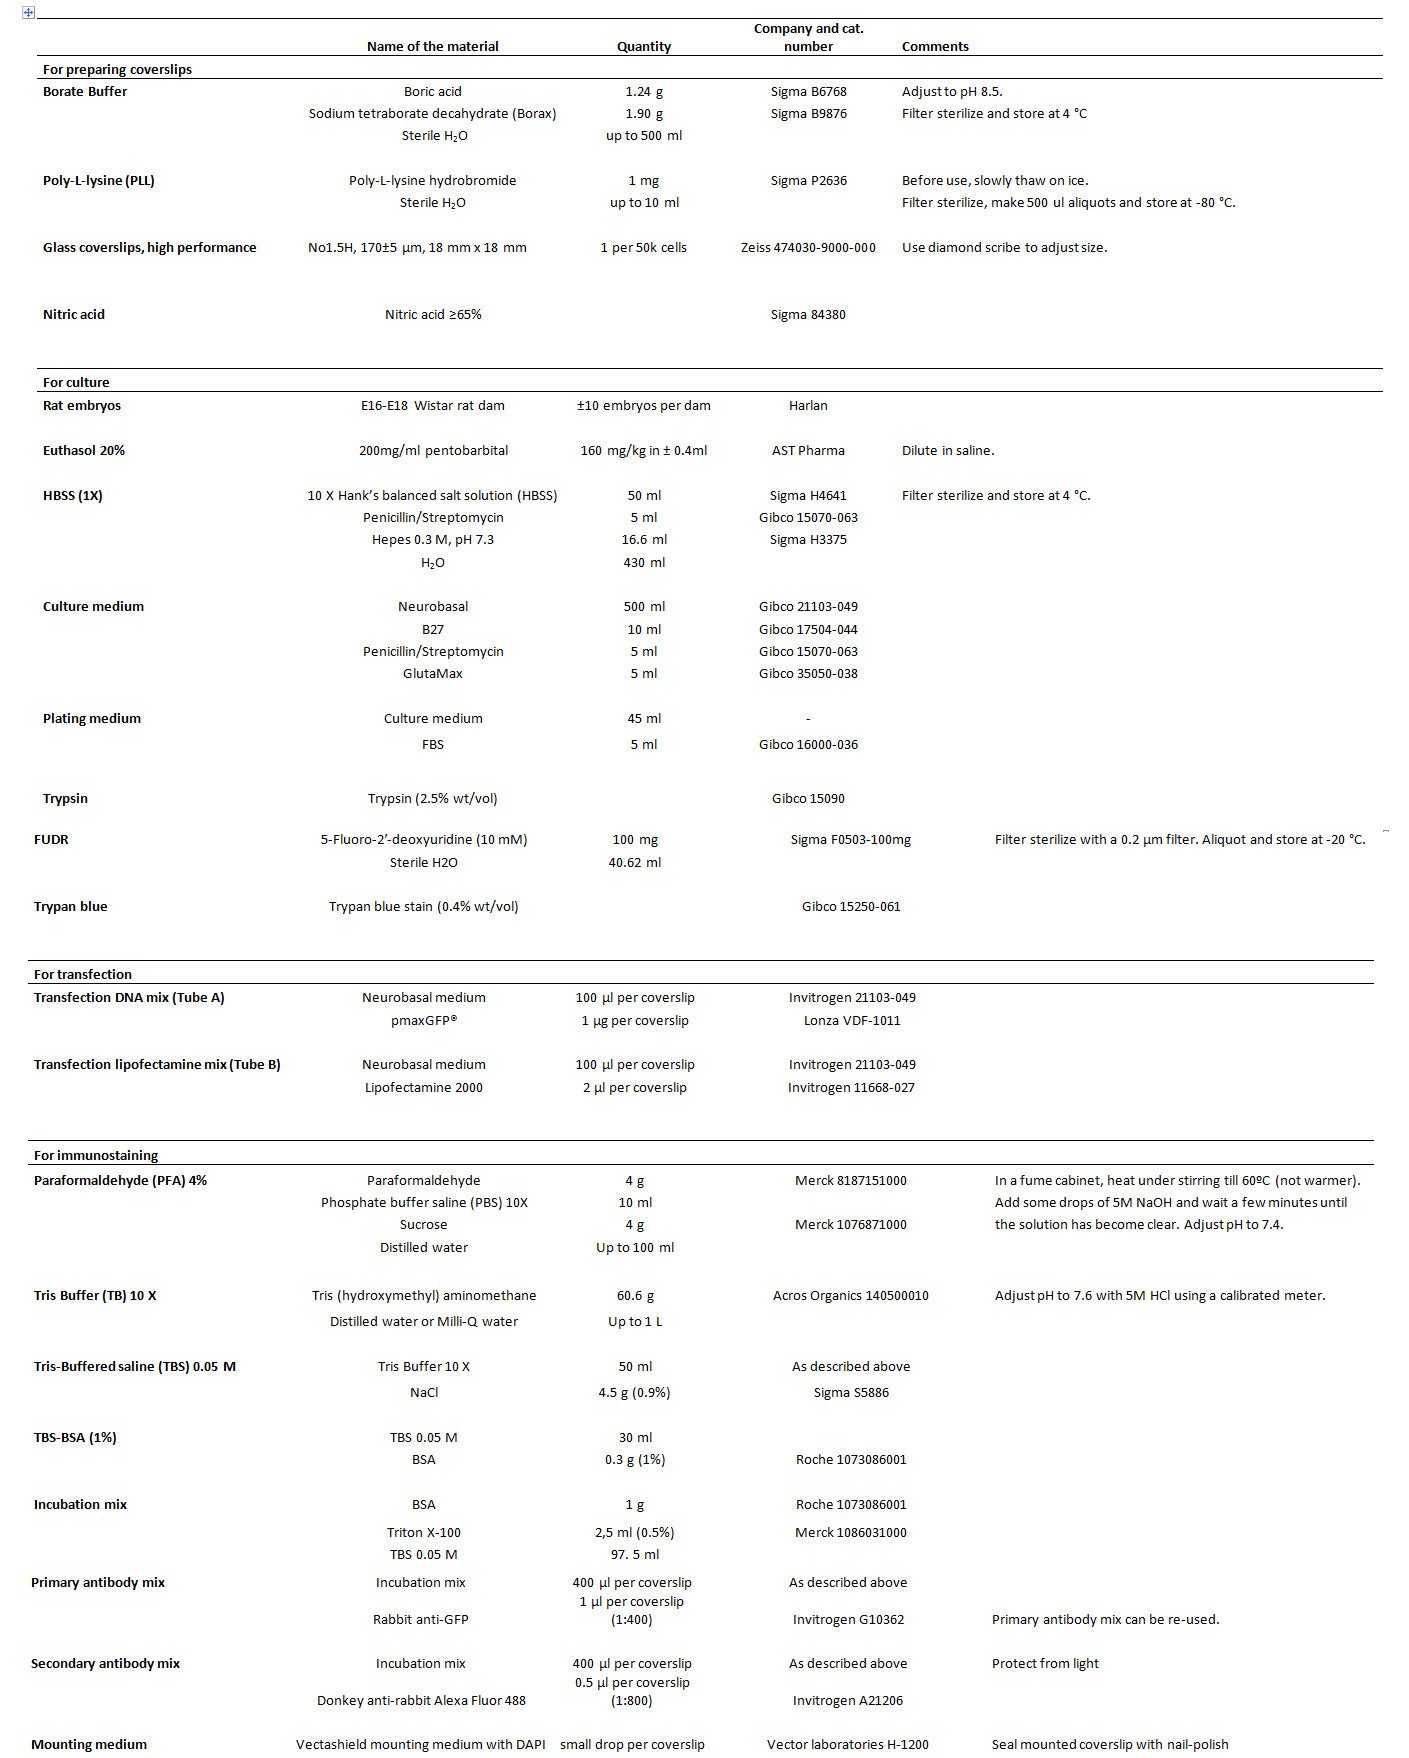
Table 1. List of reagents.
Discussion
In this article a working protocol to image dendritic spines from rat primary hippocampal neurons cultured in vitrousing SIM is described. The primary hippocampal neuron culture method is an adaptation of the original method described by Kaech and Banker 18. The main differences are the use of Neurobasal/B27 culture medium, which eliminates the requirement of astroglial feeder cultures, and the addition of the mitotic inhibitor FUDR on day 3 which promotes neuronal survival while suppressing glial proliferation, as described by Brewer et al 19.
There are many critical steps in the protocol. The thickness of the coverslips used to plate the cells is crucial for an accurate SIM experiment. Sterility during coverslip preparation and coating is important. Do not let poly-l-lysine-treated coverslips dry during 2.3 and 2.4. The diameter of the flame-polished pipette used in step 5.8 is crucial. Too narrow a tip will result in low cell viability at later stages. Isolation of the hippocampi as quickly as possible will ensure high cell viability. The timing of the incubation and trypsin concentrations are crucial to ensure high cell viability. Loss of trypsin enzymatic activity may also affect cell viability. Finally, the addition of FUDR in step 5.14 is crucial to promote neuron survival and inhibit glial proliferation.
The sample imaging phase is straightforward when performed following strictly the protocol described here and results in the acquisition of super resolution images that can be readily reconstructed in 3D to analyze and classify dendritic spines according to their morphological features. As shown in Figure 2, the quality of the images acquired in the SIM mode is substantially better than images of exactly the same dendritic segments and individual spines acquired using the confocal mode of the same microscope. This result suggests that the use of SIM could provide an excellent opportunity to image more than subtle changes in dendritic spine morphology, as quantified in Figures 2E and 2F.
So far, mostly (fluorescent) wide-field microscopy has been used to image live cells, due to its low phototoxicity. Similarly, due to its low phototoxic effects and good combination with conventional (genetic) fluophores, SIM allows live cells imaging and identification of dendritic spines in low fluophore expressing cells at super-resolution. In comparison to other super-resolution microscopy methods such as STED or PALM, SIM provides a quick and affordable method for the imaging of dendritic spines from rat primary hippocampal neurons in vitro. Although in practice SIM only increases resolution by two fold compared to conventional confocal microscopy.
One example of a limitation of the SIM is that it relies on fluorescence, which in some experimental setups can be difficult to apply. To this end, microscopy techniques which do not rely on fluorescence such as electron microscopy may provide a possible solution. Nevertheless, electron microscopy in particular is a tedious, expensive an slow method. Moreover, electron microscopy can only be carried out on fixed samples. Therefore, SIM is more suitable for super-resolution imaging of live cells. The rationale for applying a fluorescent protein encoding plasmid transfection is that it results in a scarce, yet reproducible cytoplasmic labeling of isolated cells, preventing overlap of dendrites from different cells and the identification of individual dendritic spines. Combination of transfection with immunostaining has been shown previously to enhance fluorescence 17. Nevertheless, other fluorescent techniques could also be applicable to the imaging of dendritic spines with SIM, for example sufficient fluorescent staining could be acquired using recently developed actin binding probes 20.
Since recent technical developments have allowed the application of SIM to dynamic cell imaging, demonstrating that high-speed structured-illumination microscope is capable of 100-nm resolution at frame rates up to 11 Hz 13, a very logical future application of the protocol described herein could be its application to time-lapse SIM of live rat primary hippocampal neurons and the analysis of fast dynamic changes in dendritic spine morphology. A next challenge for this application could be the expected cumulative phototoxicity associated with long time intervals of live microscopy.
Disclosures
This work was financed by a VIDI grant number H64.09.016 from The Netherlands Organization for Scientific Research (NWO) to CPF. CPF is grateful to Dr. Silvina A. Fratantoni for her critical comments and corrections on the final manuscript. GMRDL/EMMM are supported by the Dutch Technology Foundation STW (project 12151 and 11350), which is part of the NWO, and which is partly funded by the Ministry of Economic Affairs. We thank the Catherine Kitts and Peter Drent of Nikon Instruments Europe BV for assistance and support. HX was supported by the Royal Dutch Academy of Arts and Sciences (grant 11CDP10) and WT was supported by grant the Netherlands Organization for Scientific research (grant 820.02.006).
Materials
| Name |
| Fine forceps |
| Big forceps |
| Fine scissor |
| Big scissor |
| Blunt spatula |
| Dissecting microscope with illumination |
| Light microscope |
| 37 °C water bath |
| Laminar flow cell culture hood |
| High-temperature dry-oven |
| Bunsen burner |
| Cell culture incubator (5% CO2, 37 °C) |
| Microcentrifuge |
| Orbital shaker |
| Name |
| Nikon structured illumination microscope setup consisting of: |
| Nikon Eclipse Ti research inverted microscope with Perfect Focus System |
| Nikon CFI Apo TIRF 100x oil objective lens (N.A. 1.49) |
| 4 Coherent Sapphire Lasers (458, 488, 514 and 561 nm exitation wavelength) |
| SIM Illuminator |
| Nikon Stage Controller |
| MCL Nano-Drive piezo controller |
| Nikon Intensilight C-HGFIE mercury lamp |
| SIM Microscope Enclosure temperature control |
| Andor EM-CCD Camera iXon DU897 |
| PC with Microsoft Windows 7 Home Edition |
| Nikon’s NiS Elements 6.14 SIM software package |
| Nikon type A immersion oil |
References
- Gustafsson, M. G. Surpassing the lateral resolution limit by a factor of two using structured illumination microscopy. J Microsc. 198, 82-87 (2000).
- Yoshihara, Y., De Roo, M., Muller, D. Dendritic spine formation and stabilization. Curr Opin Neurobiol. 19, 146-153 (2009).
- Dailey, M. E., Smith, S. J. The dynamics of dendritic structure in developing hippocampal slices. J Neurosci.16, 2983-2994 (1996).
- Alvarez, V. A., Sabatini, B. L. Anatomical and physiological plasticity of dendritic spines. Annu Rev Neurosci. 30, 79-97 (2007).
- Jaworski, J., et al. Dynamic microtubules regulate dendritic spine morphology and synaptic plasticity.Neuron. 61, 85-100 (2009).
- Abbe, E. Beiträge zur Theorie des Mikroskops und der mikroskopischen Wahrnehmung. Archiv für mikroskopische Anatomie. 9, 413-418 Forthcoming.
- Gustafsson, M. G., Agard, D. A., Sedat, J. W. I5M: 3D widefield light microscopy with better than 100 nm axial resolution. J Microsc. 195, 10-16 (1999).
- Heintzmann, R., Cremer, C. G. Laterally modulated excitation microscopy: improvement of resolution by using a diffraction grating. Proc. SPIE 3568 Optical Biopsies and Microscopic Techniques III. 185-196 (1999).
- Karadaglić, D., Wilson, T. Image formation in structured illumination wide-field fluorescence microscopy.Micron. 39, 808-818 (2008).
- Schermelleh, L., et al. Subdiffraction multicolor imaging of the nuclear periphery with 3D structured illumination microscopy. Science. 320, 1332-1336 (2008).
- Gustafsson, M. G. Nonlinear structured-illumination microscopy: wide-field fluorescence imaging with theoretically unlimited resolution. Proc Natl Acad Sci U S A. 102, 13081-13086 (2005).
- Nagerl, U. V., Willig, K. I., Hein, B., Hell, S. W., Bonhoeffer, T. Live-cell imaging of dendritic spines by STED microscopy. Proc Natl Acad Sci U S A. 105, 18982-18987 (2008).
- Kner, P., Chhun, B. B., Griffis, E. R., Winoto, L., Gustafsson, M. G. Super-resolution video microscopy of live cells by structured illumination. Nat Methods. 6, 339-342 (2009).
- James, C. D., et al. Aligned microcontact printing of micrometer-scale poly-L-lysine structures for controlled growth of cultured neurons on planar microelectrode arrays. IEEE Trans Biomed Eng. 47, 17-21 (2000).
- Dumitriu, D., Rodriguez, A., Morrison, J. H. High-throughput, detailed, cell-specific neuroanatomy of dendritic spines using microinjection and confocal microscopy. Nat Protoc. 6, 1391-1411 (2011).
- Fitzsimons, C. P., et al. Knockdown of the glucocorticoid receptor alters functional integration of newborn neurons in the adult hippocampus and impairs fear-motivated behavior. Mol Psychiatry. (2012).
- van Hooijdonk, L. W., et al. Lentivirus-mediated transgene delivery to the hippocampus reveals sub-field specific differences in expression. BMC Neurosci. (2009).
- Kaech, S., Banker, G. Culturing hippocampal neurons. Nat Protoc. 1, 2406-2415 (2006).
- Brewer, G. J., Torricelli, J. R., Evege, E. K., Price, P. J. Optimized survival of hippocampal neurons in B27-supplemented Neurobasal, a new serum-free medium combination. J Neurosci Res. 35, 567-576 (1993).
- Izeddin, I., et al. Super-resolution dynamic imaging of dendritic spines using a low-affinity photoconvertible actin probe. PLoS ONE. 6, (2011).
*所属および掲載内容は取材当時のものです。